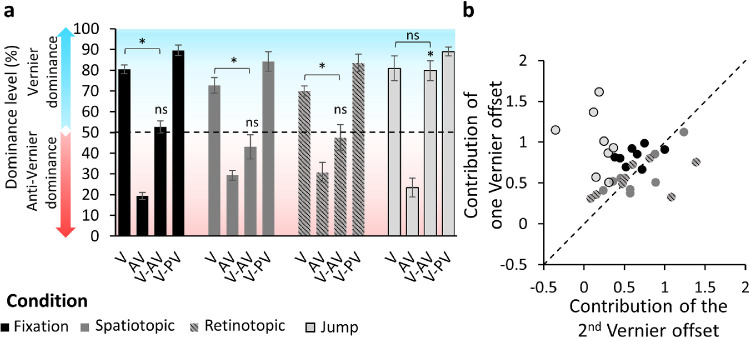
Figure 3.
Experiment 1. (a) Dominance level as a function of the different configurations of the SQM for the fixation (black), spatiotopic (dark gray), retinotopic (dark gray/gray dashed), and jump (light gray) conditions. A dominance level above 50% (blue part of the plot) indicates that the central vernier dominated performance; a dominance level below 50% (red part of the plot) indicates that the anti-vernier dominated performance. Offset sizes were calibrated in the fixation condition to yield 75% to 80% dominance when only one line was offset (V or AV). The dominance level in the AV condition was 19.4%; that is, it was 80.6% correct in accordance with the flanking line offset. In the fixation condition V-AV, the dominance level was around 50%; that is, the offsets canceled each other. When the offsets were in the same direction (V-VP), the dominance level was around 90%; hence, the offsets integrated. The same pattern was observed in the spatiotopic and retinotopic conditions. In the jump condition, dominance in the V-AV configuration was around 80%, indicating that the offsets did not integrate. Error bars represent SEM. ns, pHolm > 0.05; *pHolm ≤ 0.05. Individual data are presented in the Supplementary Material (Supplementary Figure S4). (b) Contribution of one vernier offset (average of percent correct in V and AV) as a function of the contribution of the other vernier offset ([(V-PV) – (V-AV)]/2), when both offsets were present for each observer and each condition in z-score space. The diagonal represents perfect integration (both offsets contributed equally to the performance). The fixation (black), spatiotopic (dark gray), and retinotopic (gray dashed) conditions are close to the diagonal, showing integration of the offsets. The jump condition (light gray) forms a cluster above the diagonal, indicating that the central offset dominated performance.

