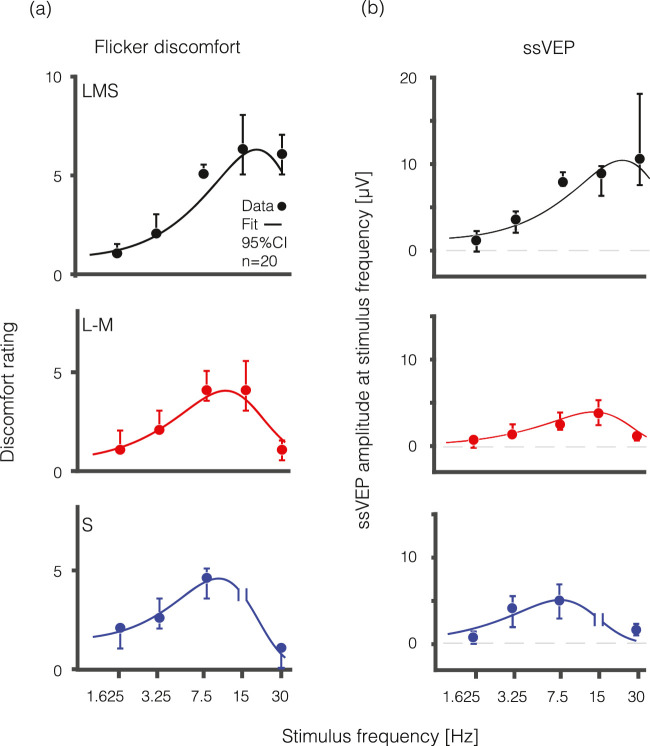
Figure 2.
Visual discomfort ratings and visual cortex evoked responses across temporal frequency and spectral modulations. Median visual discomfort ratings on a 0 to 10 scale (a) and visual evoked response at the fundamental stimulus frequency represented in mV (b) are shown as a function of temporal frequency (Hz) for LMS (black), L-M (red), and S (blue) flickering stimuli. Measurements from the S cone directed stimulus flickering at 15 Hz were omitted (following our preregistered protocol) as this stimulus was accompanied by a prominent, spatially structured “brightness” percept that we were unable to remove. Data are collapsed across HAf (n = 10) and MwA (n = 10) subjects. Error bars represent 95% confidence interval by bootstrap analysis. Fit line is derived from a difference-of-exponentials function.

