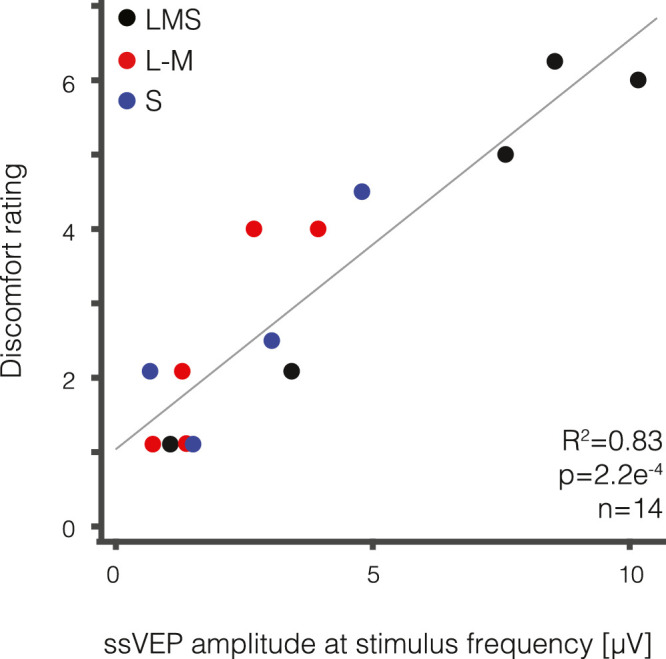
Figure 3.

Visual discomfort strongly correlates with visual evoked response. The median visual discomfort rating (0–10 scale) is plotted as a function of the median visually evoked response (in µV) for each of the 14 unique stimuli designed to stimulate the LMS (black), L-M (red), and S (blue) pathways. There is a strong correlation between visual discomfort and visually evoked response (R2 = 0.83, p = 2.2e–4).
