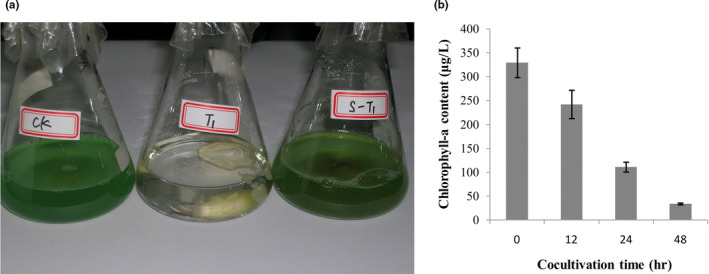
FIGURE 1.

Changes in the algicidal process of B. adusta T1. Note: (a) Images of cocultivation after 48 hr; CK, the cyanobacterial cells as control;T1, the cocultivation of cyanobacterial cells and B. adusta T1 mycelia; S‐T1, the cocultivation of cyanobacterial cells and died fungal mycelia. (b) Changes in chlorophyll a content during the algicidal process
