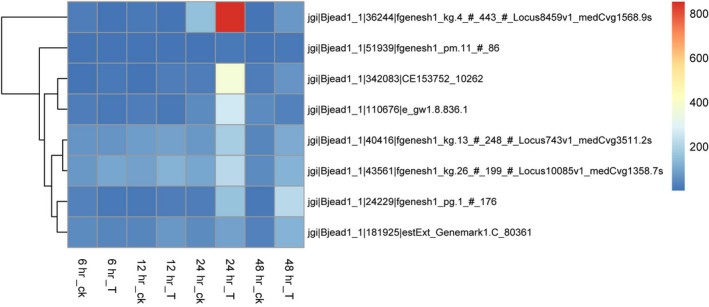
FIGURE 9.

Time‐course change of protease genes expression level of T1 cocultivation with cyanobacteria. Note: 6h_ck, control sample at 6h; 6h_T, treatment sample at 6 hr; 12h_ck, control sample at 12 hr; 12h_T, treatment sample at 12 hr; 24h_ck, control sample at 24 hr; 24h_T, treatment sample at 24 hr; 48h_ck, control sample at 48 hr; 48h_T, treatment sample at 48 hr
