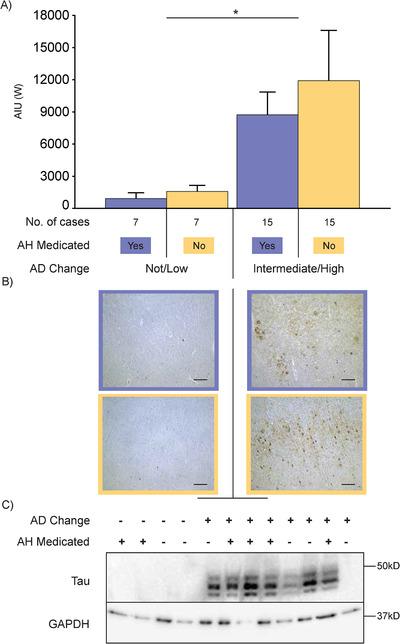
FIGURE 2.

A, Bar graph showing amounts of tau (Alz50) in the frontal cortex of cases with a not/low or intermediate (int)/high level of Alzheimer's disease (AD) neuropathologic change that is further dichotomized into antihypertensive medication (AH Medicated) use (yes = “+” and orchid color, no = “−” and cantaloupe color) as measured in arbitrary intensity units (AIU) by western immunoblotting. Case types and number of cases illustrated in key underneath the bar graph. Error bars = standard error of the mean. *P < .05 Western for not/low AD versus int/high AD. B, Representative immunomicrographs of tau (AT8) in the frontal cortex. Those on the left‐hand side are cases that have a not/low level of AD change while cases on the right‐hand side are those that have an int/high level of AD change. Micrographs with an orchid‐colored border denote cases that had taken antihypertensive medications while micrographs with a cantaloupe‐colored border denote cases that had not taken antihypertensive medications. Scale bars = 200 µm. C, Representative immunoblots of the western data presented in (A). Lanes denoted as AD Change “−” indicate not/low level of AD change while those denoted as AD Change “+” indicate int/high level of AD change. Lanes denoted as AH Medicated “‐” indicate cases that had not taken antihypertensive medications while those denoted as AH Medicated “+” indicate cases that had taken antihypertensive medications
