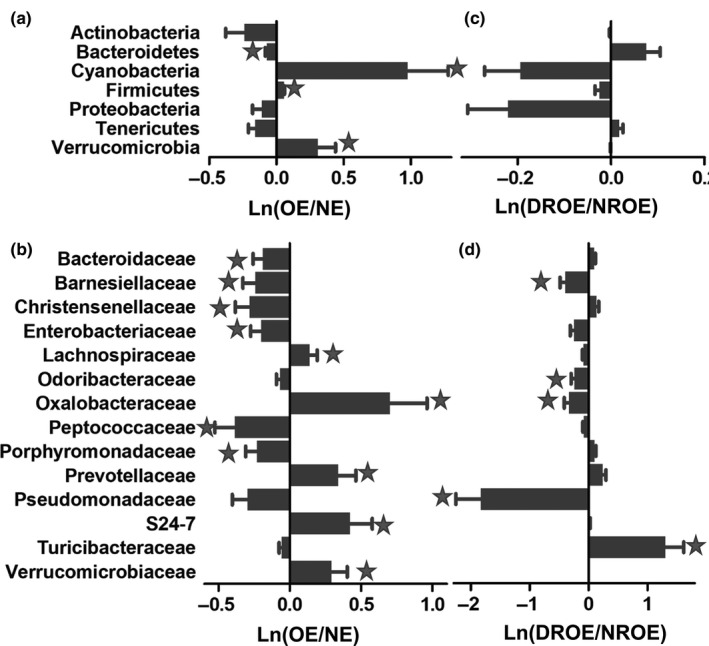
FIGURE 5.

Alteration of the microbial composition in OE individuals. Comparison of the microbial compositions in OE and NE individuals at the (a) phylum and (b) family levels. Comparison of the microbial composition in the DROE and NROE groups at the (c) phylum and (d) family levels. The star represents p < .05
