
FIGURE A2.
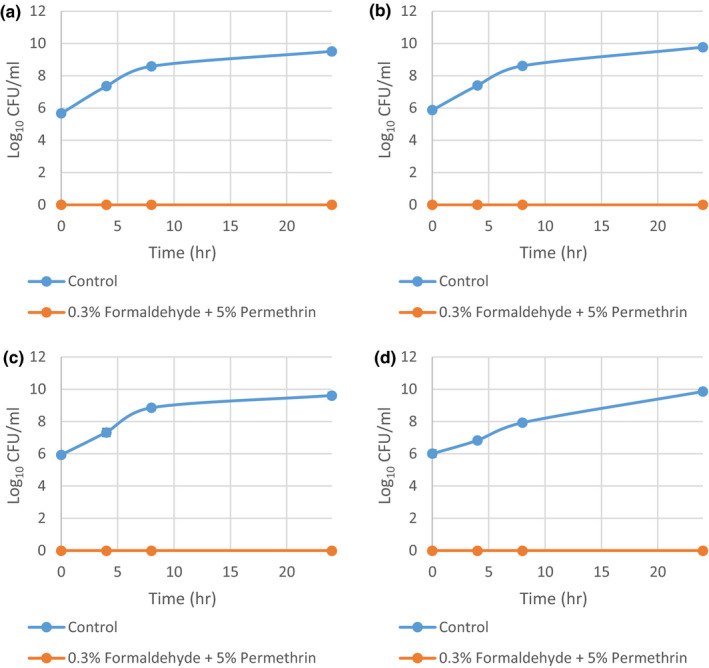
Time‐kill curves of methicillin‐resistant Staphylococcus aureus grown in 0.3% formaldehyde and 5% permethrin combined from three independent runs with standard deviation of the mean error bars. (a) MRSA 2; (b) MRSA 8; (c) MRSA 9; and (d) MRSA 13