
FIGURE A1.
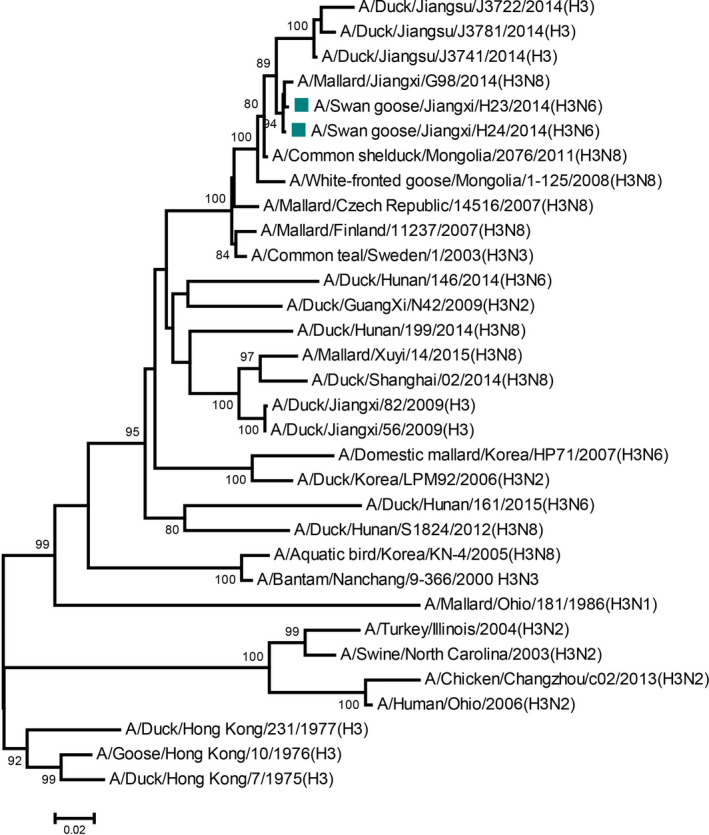
Phylogeny of HA gene of all analysed sequences. Phylogeny of the HA gene was constructed using the maximum likelihood method with 1,000 bootstrap replicates in MEGA v6.06. Jiangxi H3N6 viruses were highlighted by squares. Bootstrap values > 80% were shown on the branches