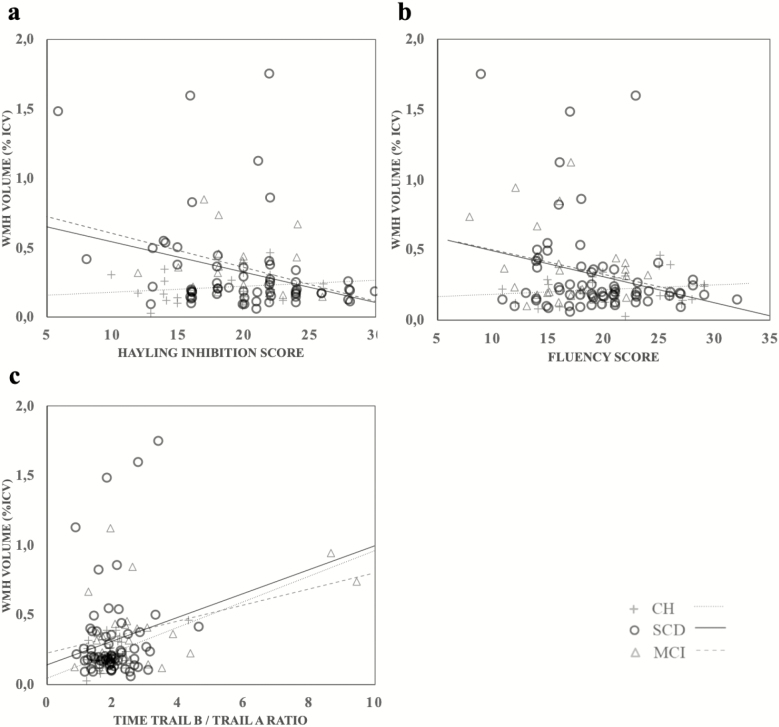
Figure 3.
Scatter plots and lines of best fit for the relation between (a) white matter hyperintensities and the Hayling inhibition score; (b) White matter hyperintensities and the Fluency score; and (c) White matter hyperintensities and Memoria free recall score. CH = cognitively healthy; MCI = mild cognitive impairment; SCD = subjective cognitive decline; WMH = white matter hyperintensities.

