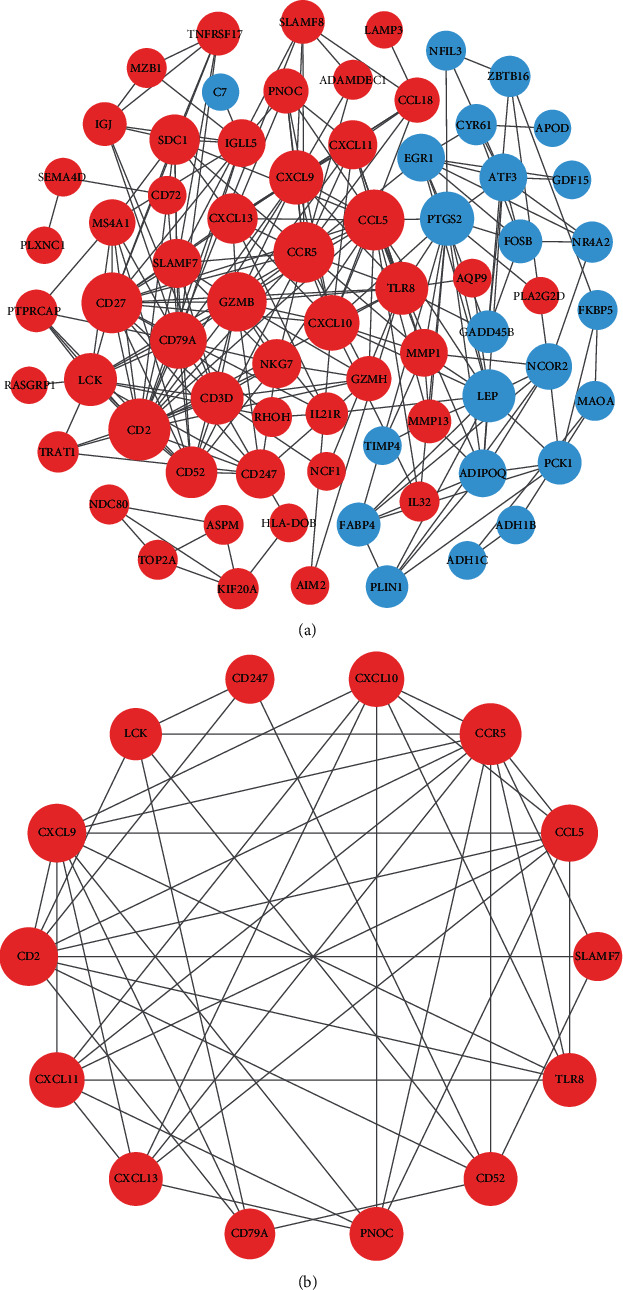
Figure 5.

PPI network construction and module analysis. (a) The PPI network of DEGs was constructed in Cytoscape. (b) The most significant module was obtained by MCODE plug-in. Upregulated genes were marked with red color, and downregulated genes were blue. The diameters of nodes were positively correlated with their connectivity degree.
