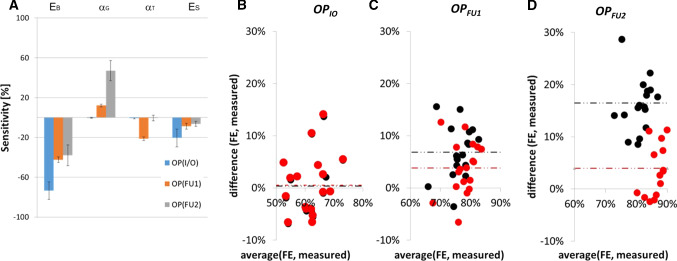
Fig. 6.
a Model sensitivity histogram from the DoE performed on nine patients. Bland–Altman plot showing a comparison between the results of simulations vs measurements in case of literature values of material properties (black) and population optimized material model (red) for b insertion (OPIO), c follow-up 1 (OPFU1), d follow-up 2 (OPFU2); results are shown in terms of percentage of nominal spring size (60 mm)

