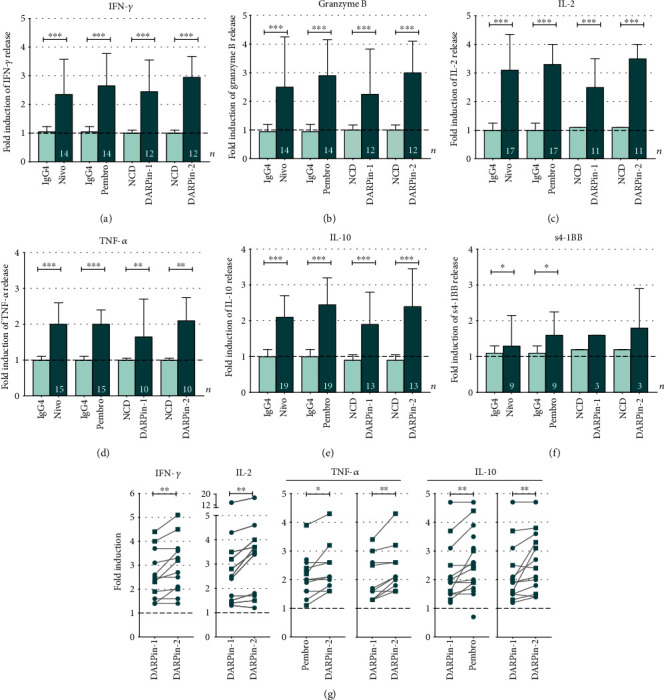
Figure 4.

Fold induction of secreted soluble factors from T-cells isolated in the presence of α-CD3 and 100 nM of PD-1-directed reagents. T-cells from the ascites (n = 14) and tumor (n = 5) were activated and cultured with α-CD3 (OKT-3) and 100 nM of PD-1-directed reagents or controls for 48 h. Results were generated using a multiplex immunoassay (Luminex) for (a) IFN-γ, (b) granzyme B, (c) IL-2, (d) TNF-α, (e) IL-10, and (f) soluble 4-1BB (s4-1BB)/sCD137 in samples of ascites and tumor (presented together). Fold induction was calculated based on the release when adding only α-CD3 with no presence of anti-PD-1 reagent or control (represented by a dashed line at 1). Several ascites samples reached the upper detection limit in all conditions (including α-CD3 alone) and were excluded for several cytokines. The total number of samples evaluated is presented in each bar (n). (g) The response by different anti-PD-1 reagents was compared with each other, and significant findings are presented. Although data from the ascites and tumor is pooled together, ascites samples are presented as circles and tumor samples as squares. Lines represent paired comparisons in which presented reagents have been assessed in parallel (in the same sample). Wilcoxon signed rank test was used for all statistical comparisons. Median values and interquartile ranges are plotted. Significance levels were set to ∗p < 0.05, ∗∗p < 0.01, and ∗∗∗p < 0.001.
