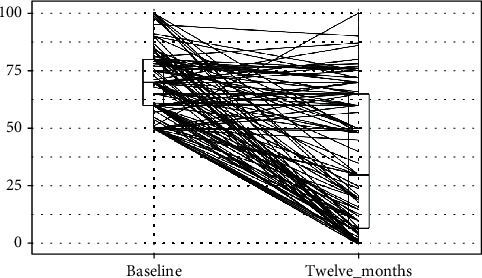
Figure 1.

VAS scores at baseline and at twelve months follow-up. y-axis: Visual Analogue Scale (VAS) for pain value; boxplot showing L-estimators: maximum (100), minimum (50), median (70), and interquartile range (20); outliers plotted as individual points at baseline and maximum (100), minimum (0), median (30), and interquartile range (58); outliers plotted as individual points at 1 year follow-up. x-axis: Visual Analogue Scale (VAS) for pain at preoperative baseline and at twelve months follow-up. Connecting lines: heuristic visualization of single-patient trajectories of variation of Visual Analogue Scale (VAS) value for pain between preoperative baseline and twelve months follow-up; plotted with R (version 4.0.0 or higher; libraries ggpubr and PairedData). Source: Authors' Data and reproducible statistical analysis with Open Access statistical software R (version 4.0.0 or higher).
