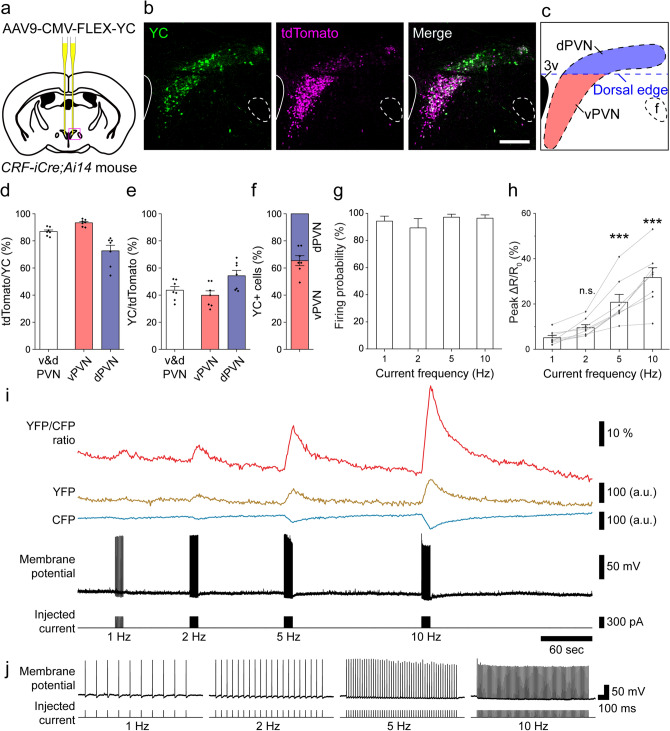
Figure 1.
Expression and function of YC in PVN-CRF neurons. (a) Injection position of AAV9-CMV-FLEX-YC in the brain. (b) Expression of YC in PVN-CRF neurons of CRF-iCre;Ai14 mice. Green: YC, magenta: tdTomato, scale bar: 200 μm. (c) Schematic diagram of the ventral (red) and dorsal (blue) PVN (vPVN and dPVN, respectively) in (b). The blue dotted line indicates the mediolateral line through the dorsal edge of the third ventricle which defines the boundary between the vPVN and dPVN. 3v third ventricle, f fornix. (d) Percentage of tdTomato-expressing (tdTomato+) cells among the YC-expressing (YC+) cells in the v&d PVN, vPVN or dPVN, where v&d PVN indicates the entire PVN. (e) Percentage of YC+ cells among the tdTomato+ cells in the v&d PVN, vPVN or dPVN, where v&d PVN indicates the entire PVN. (f) Occupancy of YC+ cells in the vPVN and dPVN within the entire PVN. (g) Probability of action potentials induced by pulse current injection. (h) Summary of peak ΔR/R0 for pulse current injection-induced action potentials. Statistical analysis was performed using a Kruskal–Wallis test followed by Dunn’s test vs. 1 Hz (***p < 0.001; n.s., not significant). (i) Representative trace from simultaneous recording of the calcium signal and membrane potential. Command current was injected through a patch pipette. The frequencies of the injected currents are indicated below the trace. (j) Magnified trace of each current injection-induced firing. The frequencies of the injected currents are indicated below the trace. Bar graphs, error bars and dots show the mean value, standard errors and individual data, respectively.

