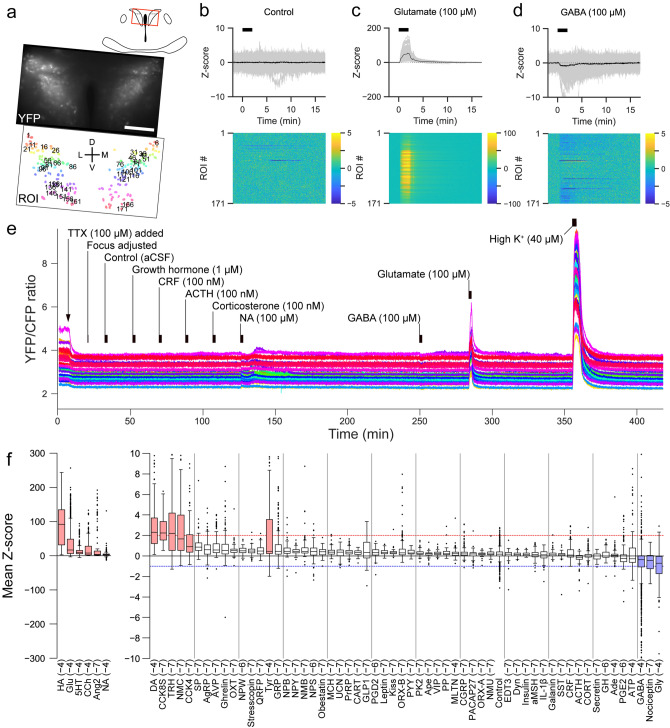
Figure 2.
Screen for substances affecting intracellular calcium concentration in PVN-CRF neurons. (a) YFP signal at baseline (upper) and in the regions of interest (ROIs, lower) of a representative brain slice. Numbers superimposed over the ROIs align with the dorsoventral axis (from dorsal to ventral). D dorsal, V ventral, L lateral, M medial; scale bar: 100 μm. (b–d) Z-scores of the YFP/CFP ratio recorded from the brain slices shown in (a). Upper graphs show traces of individual ROIs (gray) and mean values (black). Black bars indicate the application timing (2 min) of each substance indicated above the graph (b, control; c, glutamate; d, GABA). Heat maps show the Z-scores of individual ROIs indicated by the color bars at right. (e) Entire sequence of the YFP/CFP ratio for 1 in every 5 ROIs (35 total ROIs, shown as numbers in a) of the brain shown in (a)–(d). (f) Box plots of the calcium signal changes induced by the substances indicated below. In the box plots, the top and bottom of each box indicate the 75% and 25% points, respectively. The line inside the box indicates the median value. Upper and lower ends of the whiskers indicate the points no more than the IQR (interquartile range) × 1.5 from the edge of the box, where IQR = (the value of the 75% point) – (the value of the 25% point). Dots indicate outliers which are data points beyond the whiskers. Abbreviations are listed in Table 1. The compounds are listed in the order of median value. Values in parentheses indicate the Log10 concentration of the substances in mol/L. Red and blue lines indicate where the mean Z-score = 2 and − 1, respectively. Boxes filled in red or blue indicate the substances which increased or decreased intracellular calcium concentrations, respectively.

