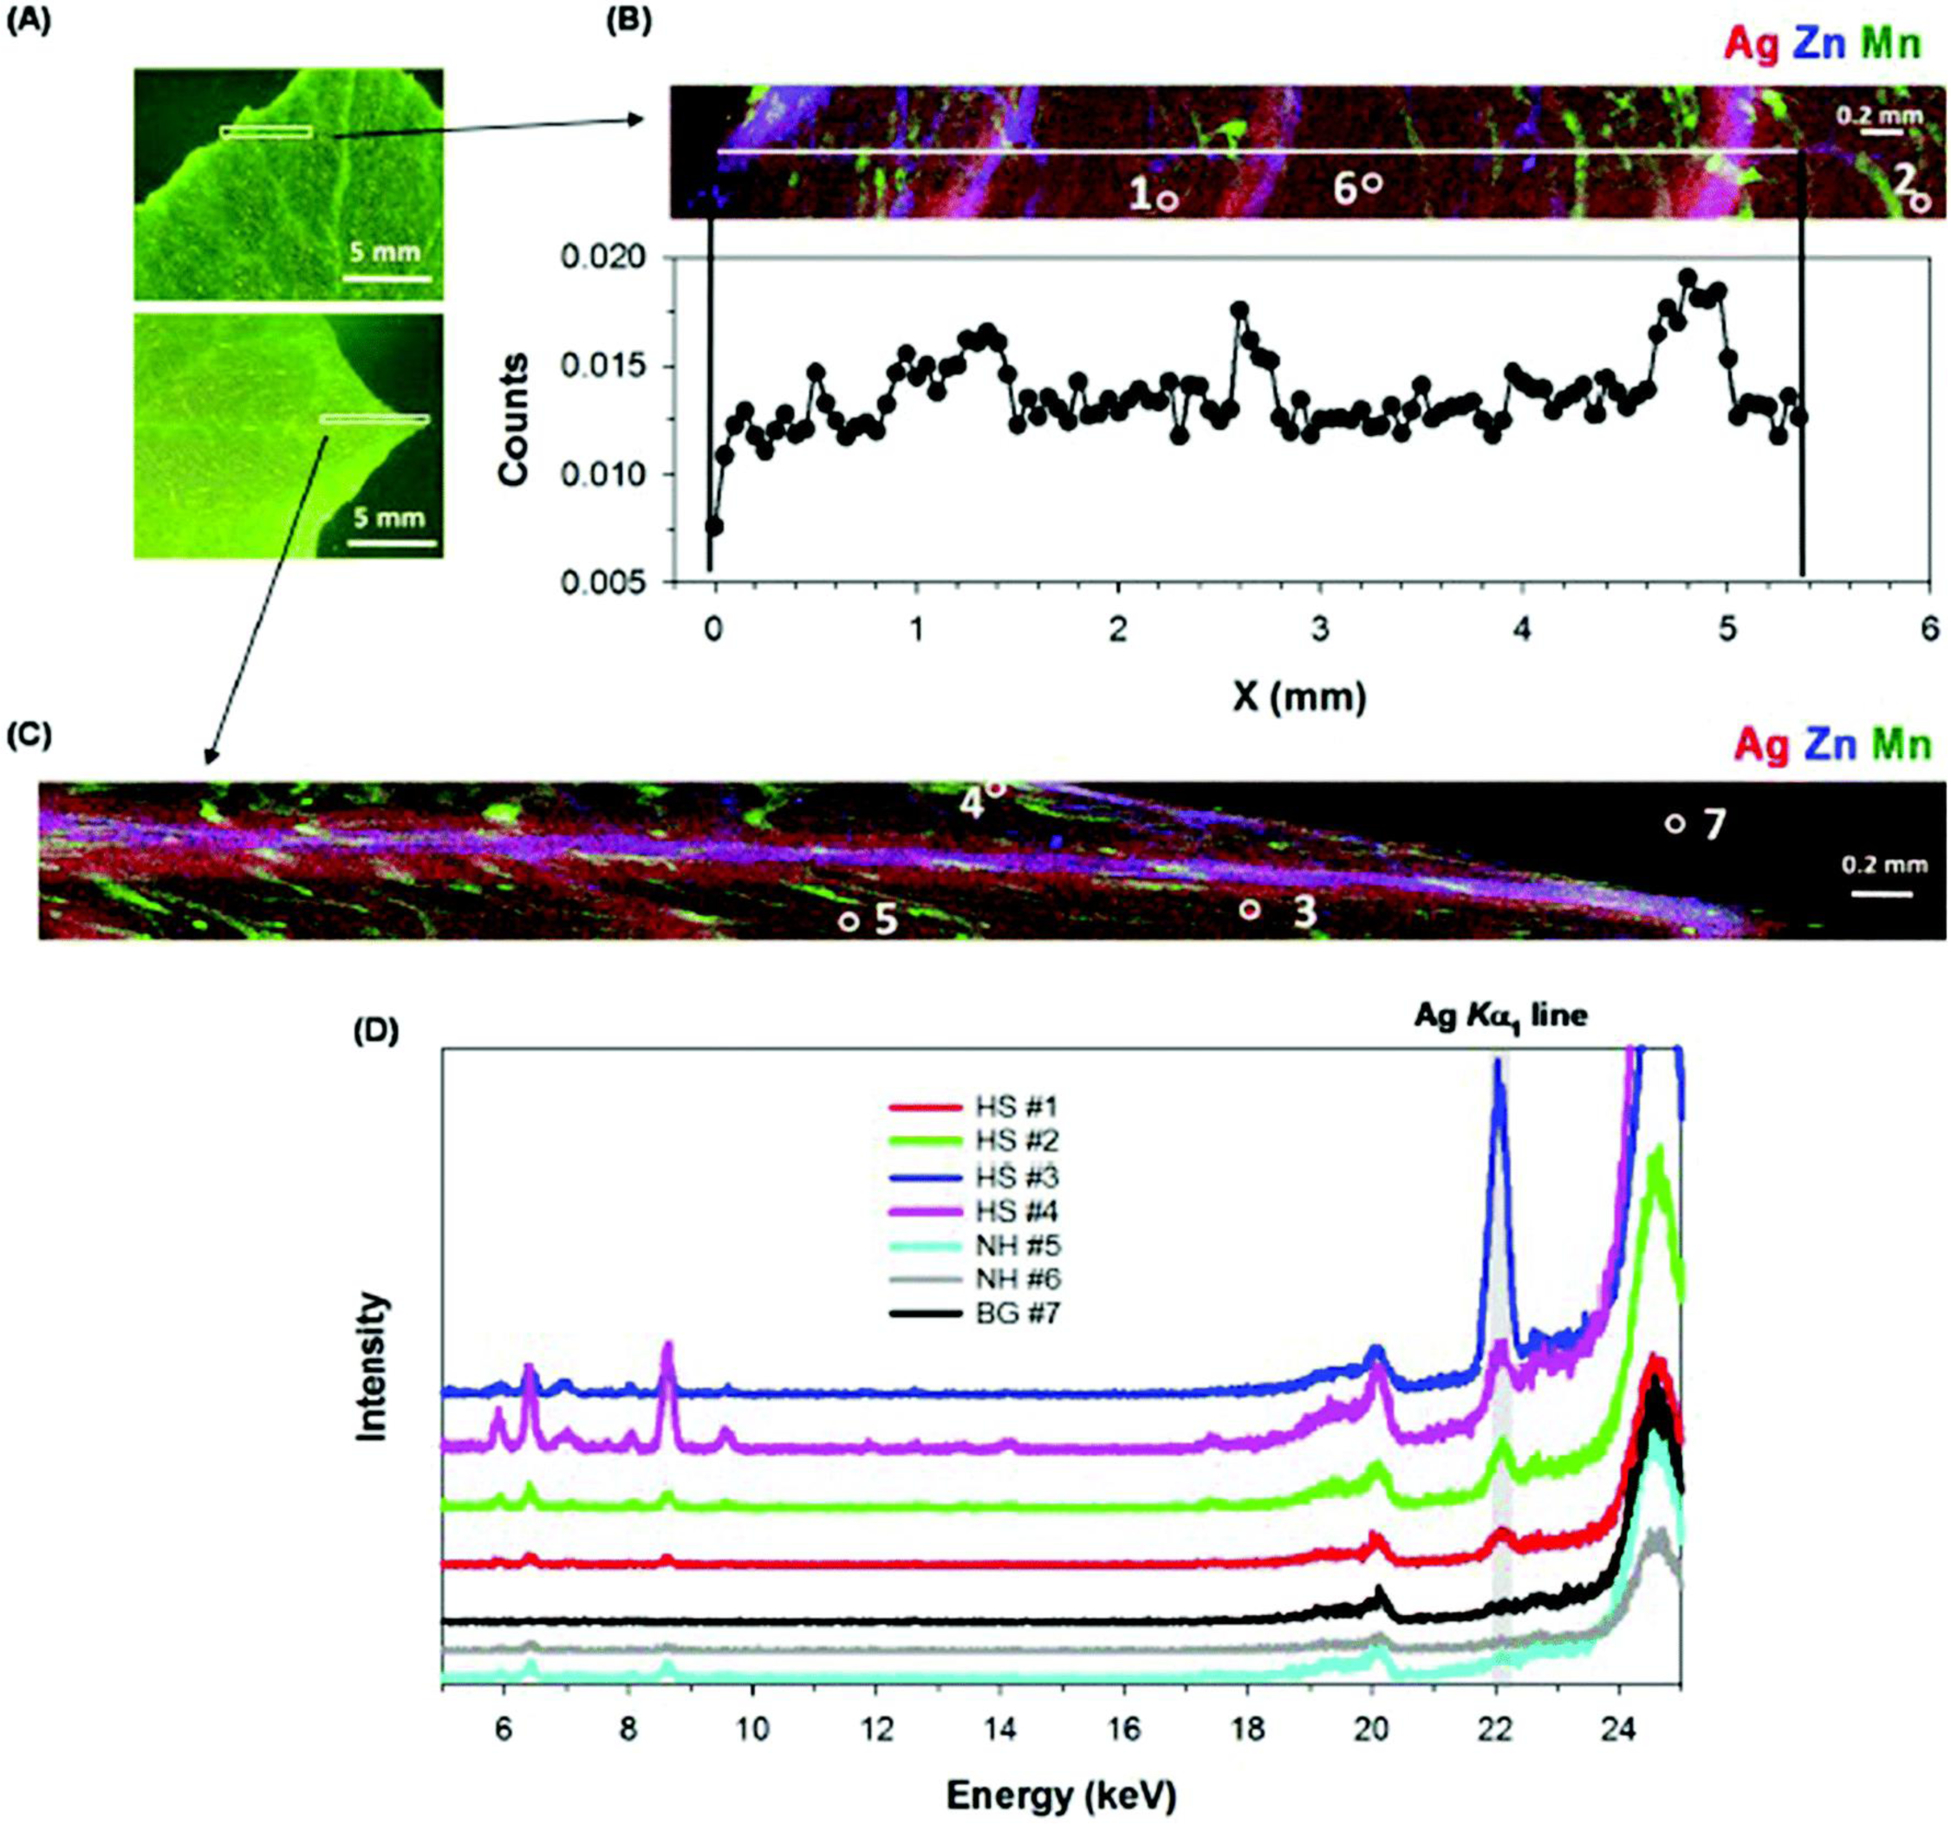
Fig. 5.

Leaves of cucumber grown in nutrient solution containing 10 mg Ag L−1 as Ag2S-NPs for one week. (A) Light micrograph after XFM analysis, with the white box indicating the area examined by XFM. (B and C) Tricolor XFM map of Ag (red), Zn (blue), Mn (green) distribution, and in (B) with Ag count profile along the white line as shown in the top panel. (D) Fluorescent intensity of XFM spectra collected at 27 keV for hotspots (HS #1–4), non-hotspots (NH #5–6), and background (BG #7) as shown in (B) and (C).
