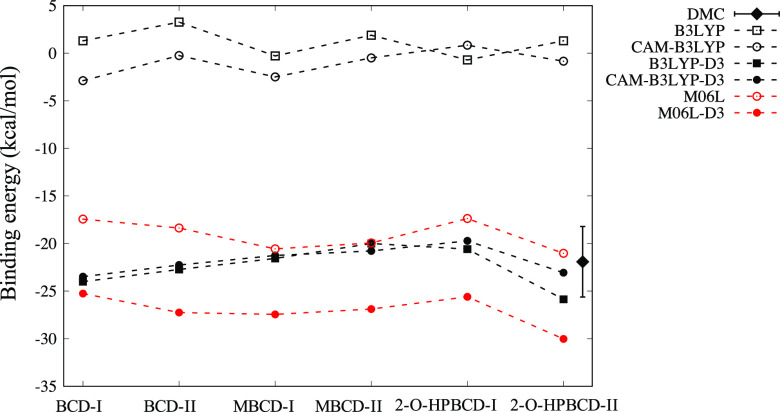
Figure 3.
Comparison of binding energies predicted by DMC and DFT with the selected functionals. Closed and open symbols with the same shape correspond to the XC functional with and without D3 correction. DMC was applied only to 2-O-HPBCD-II, since the DMC calculation cost is high. The difference between type I and type II is the location of the hydroxyl phenolic group on plumbagin. The conformational details are illustrated in Figure 2.

