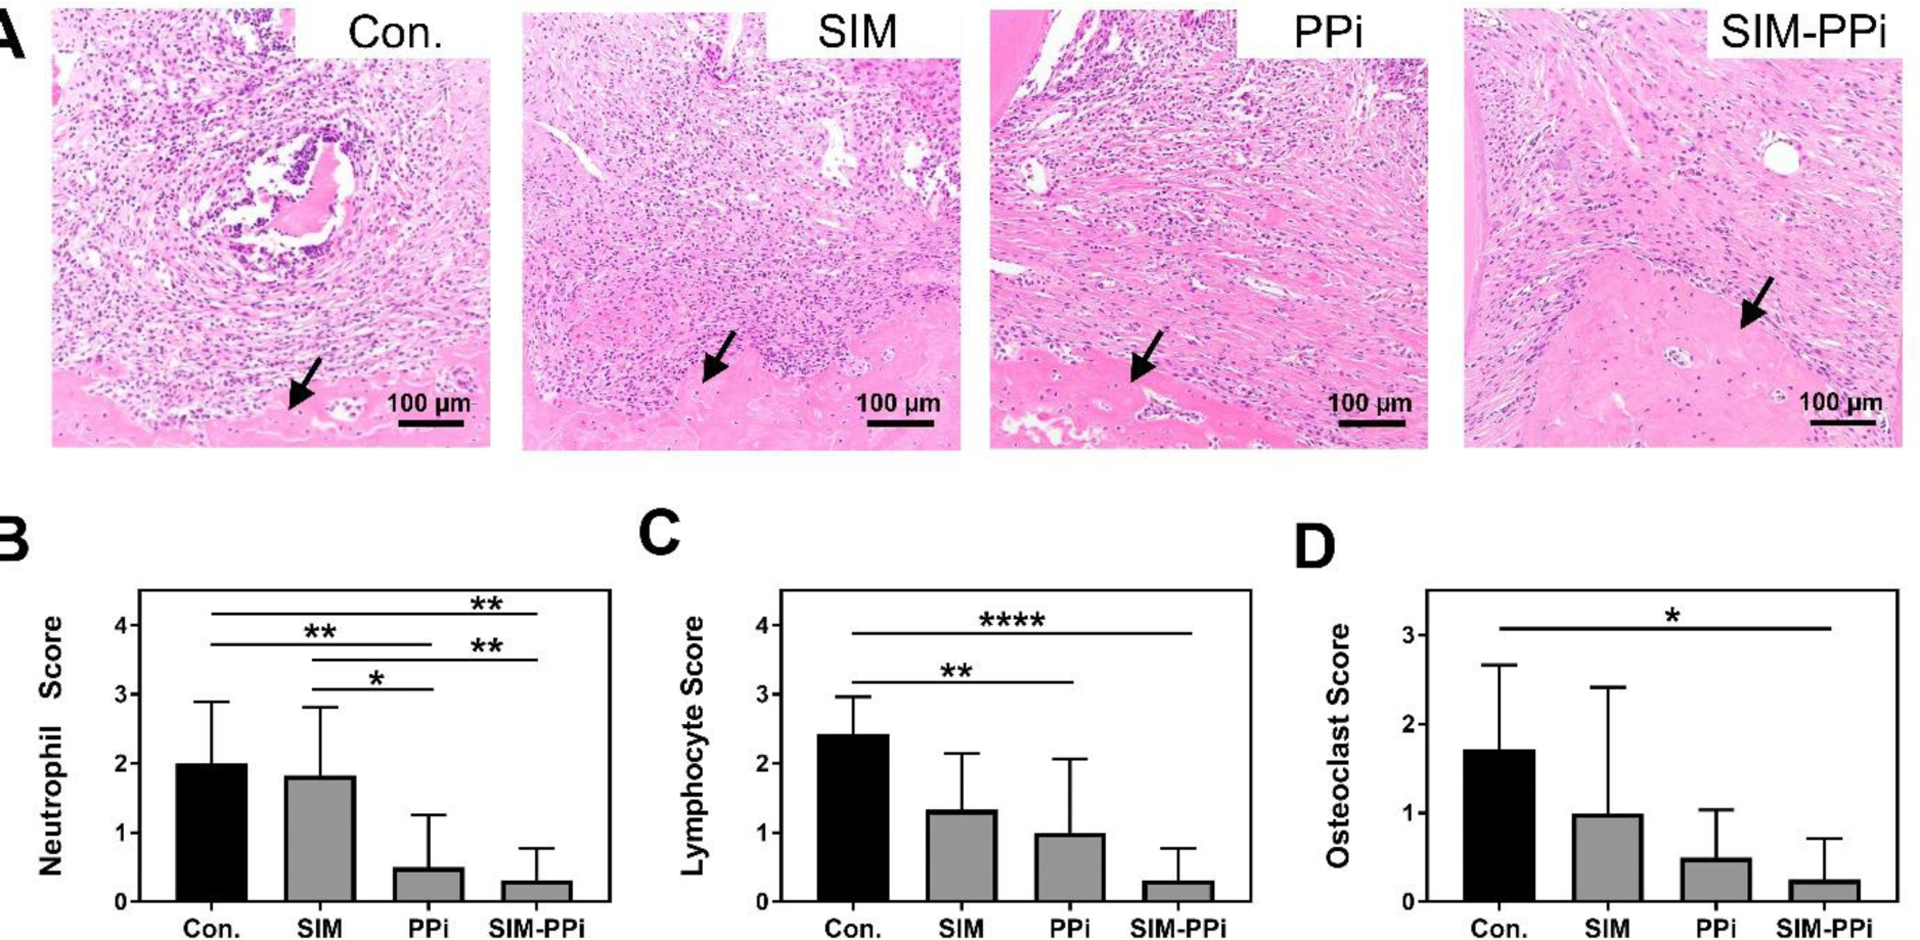
Figure 7.

Histological analysis of papillary connective tissue and alveolar bone between first molar (M1) and second molar (M2) after 3 weeks of different treatments. (A) Representative images from different treatment groups of H&E stained sections of connective tissue above the alveolar bone crest (ABC) and between first molar (M1) and second molar (M2). Black arrows indicate alveolar bone crest. (B-C) Qualitative assessment of neutrophil and lymphocytic infiltrate interproximally between first molar (M1) and second molar (M2). Scoring criteria is shown in Table II, *p< 0.05, **p< 0.01, and ****p<0.0001 (one-way ANOVA). (D) Qualitative assessment of osteoclasts lining the surface of alveolar bone crest. Scoring criteria is shown in Table III, *p< 0.05 (one-way ANOVA with Tukey’s multiple comparisons).
