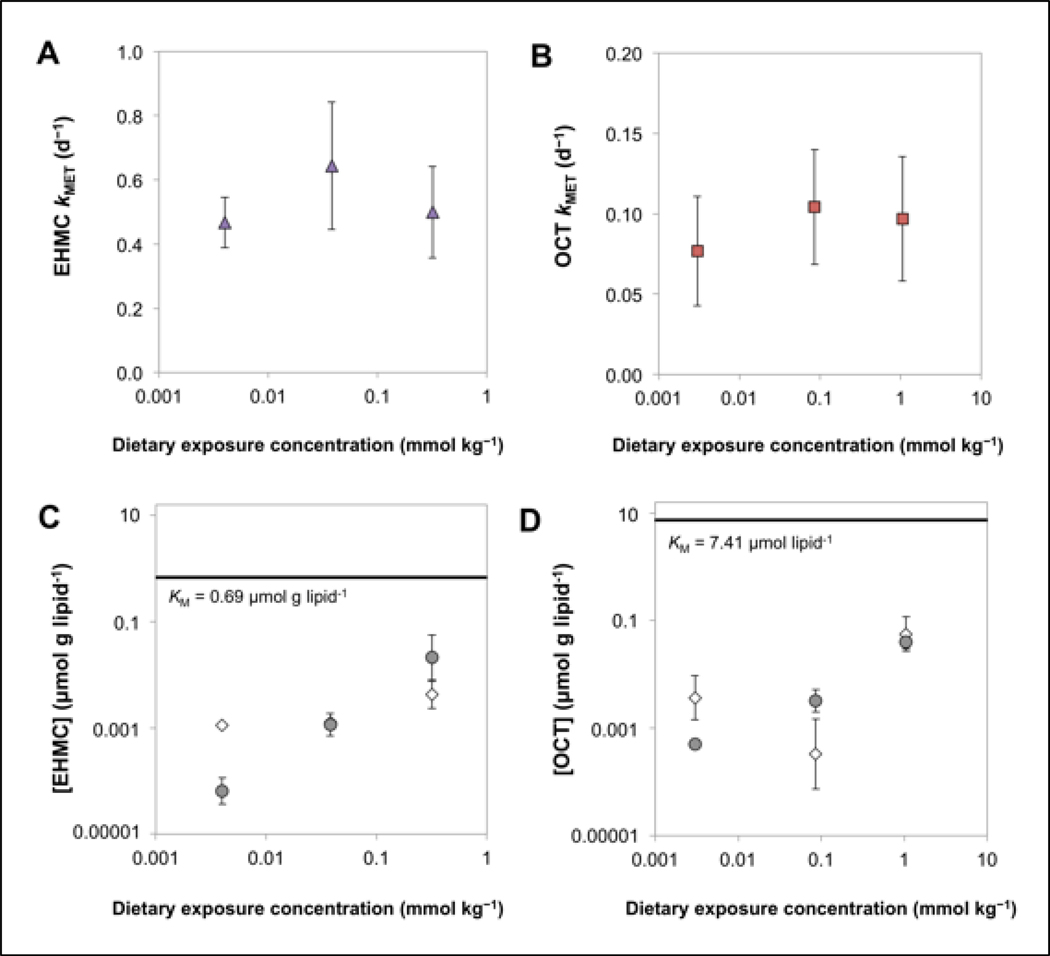
Figure 4.
Whole-body biotransformation rate constants (kMET) for EHMC (A) and OCT (B) as a function of dietary exposure concentration. Mean (± standard deviation) lipid-normalized concentrations of EHMC (C) and OCT (D) that accumulated in the fish soma (circles) and liver (diamonds) following dietary exposure. The horizontal solid lines represents the Michaelis-Menten constant (KM) previously measured in liver S9 fractions by Saunders et al. 2019.

