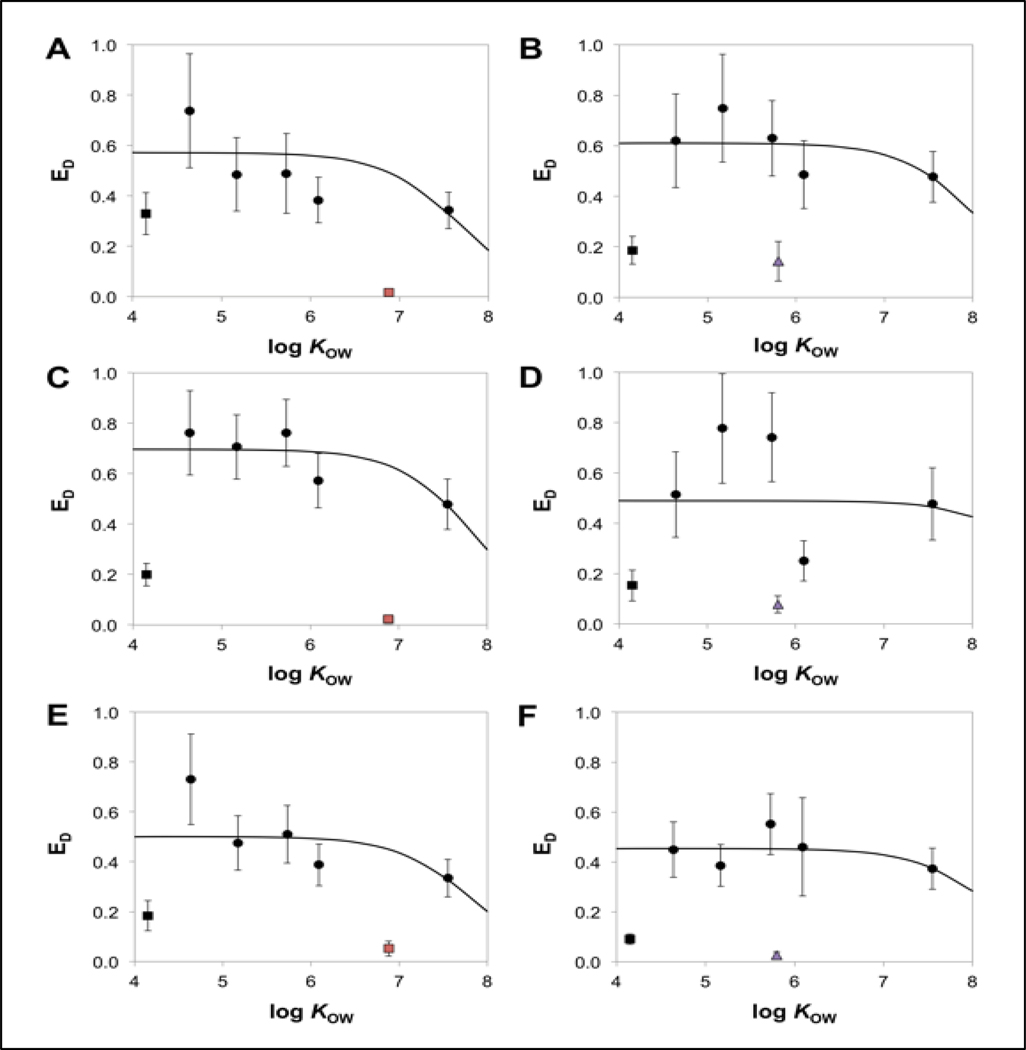
Figure 5.
Mean (± SE) dietary uptake efficiencies of the reference chemicals (black data points), OCT (red squares), and EHMC (purple triangles) versus log KOW (error bars represent the standard error of the estimate). Data generated for the OCT are presented in Panels A (high), C (medium), and E (low) whereas the data generated for EHMC are in Panels B (high), D (medium) and F (low). The solid line represents nonlinear regression fit (Equation 9) to the dietary uptake efficiency data for 5 of 6 reference chemicals (black circles) and excludes 3TCBz (black square).

