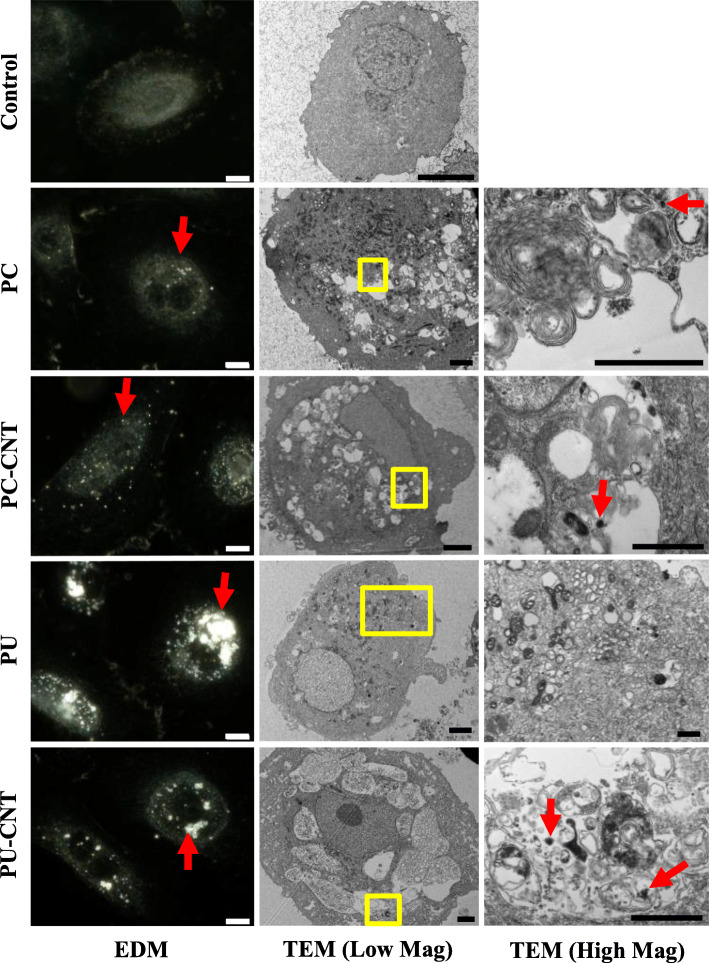
Fig. 2.
Microscopic assessment of pSAECs treated with incinerated thermoplastics. pSAECs treated with 0.6 μg/cm2 or 1.2 μg/cm2 incinerated for 48 h were visualized via enhanced darkfield microscopy (EDM) or transmission electron microscopy (TEM), respectively. Particles in suspension were also visualized by TEM (Fig. 1) for comparison against structures identified in pSAECs. Incinerated thermoplastics visualized by EDM are identified by a bright spectral signature (Magnification: 60X, scale bar = 10 μm). Cells treated with incinerated thermoplastics were visualized under low magnification (Scale Bar = 4 μm) and high magnification (Yellow Box denotes region of high magnification, Scale Bar = 1 μm). Endocytosed particles are identified by Red arrows

