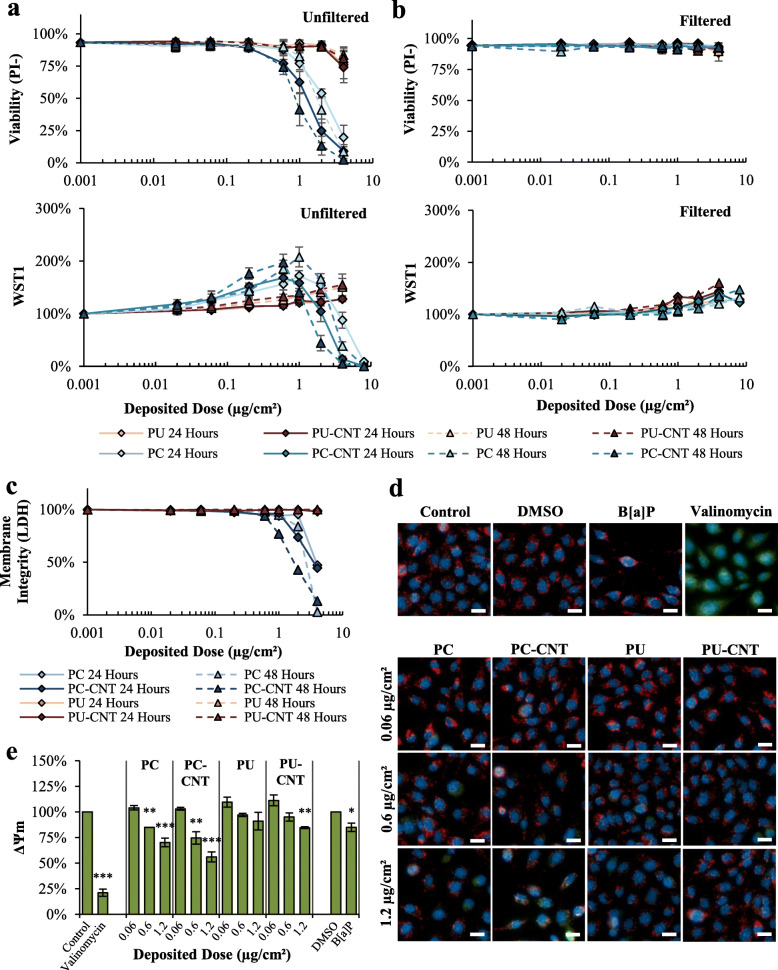
Fig. 3.
Cytotoxicity assessment of incinerated thermoplastics in Beas-2B Cells. a Dose-response curves to graded depositional doses of incinerated thermoplastics reported by live-cell imaging and WST1 reduction for particle containing suspensions. b Analogous dose-responses via live-cell imaging and WST1, except particle suspensions were filtered through a 0.2 μm pore to devoid treatments of particles, leaving only particle- associated leachables in AEGM. c Interference-adjusted LDH release 24 and 48 h after exposure to depositional doses used in live-cell imaging assessments. d-e Representative images of JC-1-reported ΔΨm measurement 24 h after exposure; scale bars = 20 μm. As a comparison, 0.5 μM B[a]P served as a representative PAH to compare to particle treatments; 10 μM valinomycin served as a positive control for ΔΨm dissipation. e Quantitative metrics of images analyzed are presented with statistical comparisons. Point estimates are the arithmetic mean of 2–4 independent experiments; error bars indicate standard error of the mean (SEM); *p < 0.05, **p < 0.01, ***p < 0.001 compared to respective controls. Images taken at 40X

