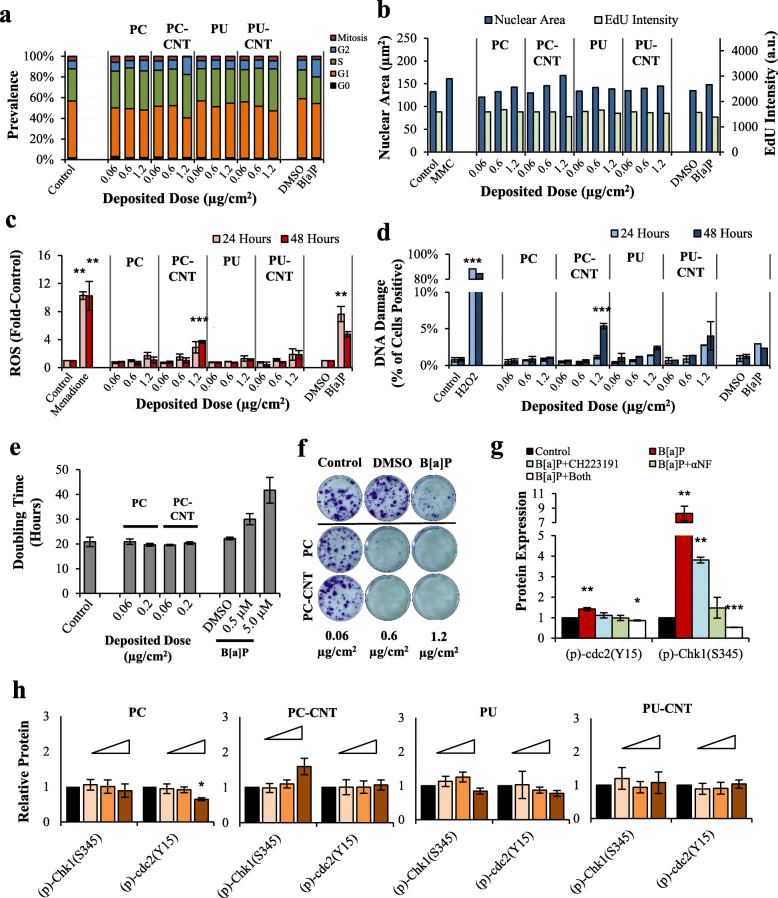
Fig. 6.
Cell cycle analysis and nuclear morphometry in Beas-2B cells. a-b Quantitative binning of cell cycle-specific phases and nuclear morphometry, including nuclear area and EdU uptake [in arbitrary units (a.u.)] analyzed from high-content screening 24-h post treatment. MMC = 0.76 ng/mL mitomycin C – a clastogen control. Results are from a single experiment. c Intracellular ROS was measured 24 and 48 h after treatment; 100 μM Menadione served as a positive control for ROS generation. B[a]P-induced intracellular ROS was significant at both time points - limited space precluded asterisk placement above the 48-h time point. d Cells treated for 24 and 48 h were stained for yH2AX; H2O2 served as a positive control. Results are presented as percent of cells positive for yH2AX out of the total cell population (> 1000/experiment). e Cells treated with PC/−CNT and B[a]P assessed for doubling time from growth curves from 3 independent experiments. f Clonogenic assay of Beas-2B cells treated for 3 days. g Western Blot analysis of B[a]P-treated cells for 24 h with and without inhibitors for AhR (Ch223191) or CYP1 (αNF). h Western Blot analysis of Beas-2B treated with 0.06, 0.6, and 1.2 μg/cm2 cells for 24 h; controls are solid black whilst concentrations are indicated by wedge where the 1.2 μg/cm2 treatment is represented by the thickest portion of the wedge. Point estimates for d and f are the arithmetic mean of 2–3 independent experiments; error bars indicate standard error of the mean (SEM); *p < 0.05, **p < 0.01, ***p < 0.001 compared to respective controls

