Figure 3.


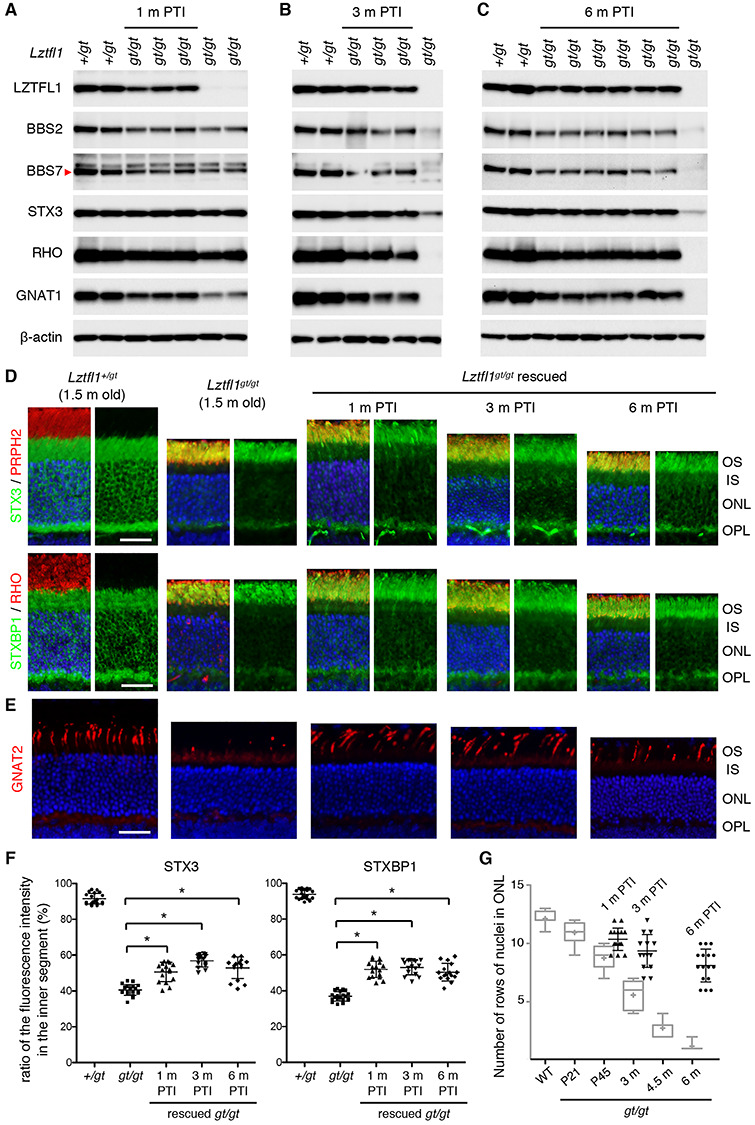
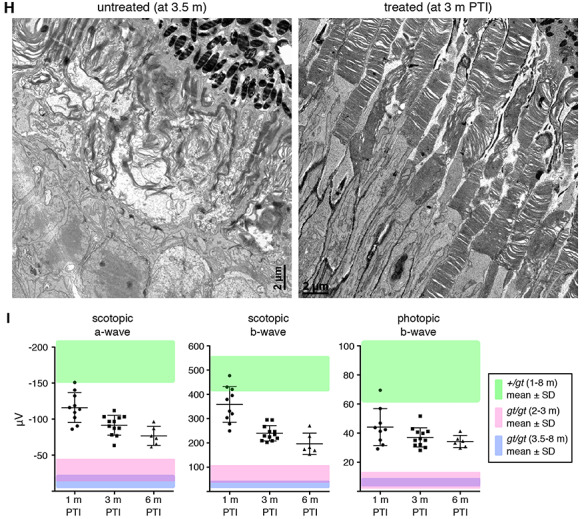
Restoring Lztfl1 expression at P5/8/12 has long-term beneficial effects but does not permanently halt retinal degeneration. (A–C) Preservation of BBSome components and phototransduction proteins at 1 month (A), 3 months (B) and 6 months (C) post-TMX injection (PTI). Age-matched Lztfl1+/gt and Lztfl1gt/gt mice (unrescued) were used as positive and negative controls. Each lane represents an individual mouse. (D) Retinal degeneration is significantly delayed but protein mislocalization is only partly corrected in the P5-rescue group. Others are the same as in Figure 2D. Scale bar denotes 25 μm. (E) Long-term preservation of cones in the P5-rescue group. Anti-GNAT2 antibody (red) was used to visualize cone OSs. (F) Quantitation of STX3 and STXBP1 localization in the inner segment. Depicted are the ratios of integrated fluorescence intensities in the inner segment relative to the photoreceptor cell layer. Data are from 4–5 mice (2 sections per mouse and 2 areas per section), and mean ± SD (error bar) is marked. Asterisks indicate statistical significance (one-way ANOVA followed by Tukey’s multiple comparison test; P < 0.01). (G) Quantitation of the photoreceptor cell layer in treated animals. The number of rows of photoreceptor cell nuclei was counted in treated animals. For direct comparison with unrescued Lztfl1gt/gt mice, data were presented in a scatter plot and overlaid on the graph shown in Figure 2C (light grey). Mean ± SD is shown (n = 4; 2 sections per mouse; 2 places per section). (H) Transmission electron micrographs (TEM) of the retinas from untreated (left; 3.5 months old) and treated (right; at 3 months PTI) Lztfl1gt/gt;FLP+ mice. (I) ERG responses of Lztfl1gt/gt;FLP+ mice treated at P5/8/12. Scotopic ERG a- and b-wave and photopic ERG b-wave amplitudes are shown in scatter plots. Error bars represent SD. Green-shaded area denotes mean ± SD of normal mice (1–8 months old) from Figure 2E. Pink- and blue-shaded areas mark mean ± SD of untreated Lztfl1gt/gt mice (2–3 months old and 3.5–8 months old, respectively) from Figure 2E.
