
Figure 6.
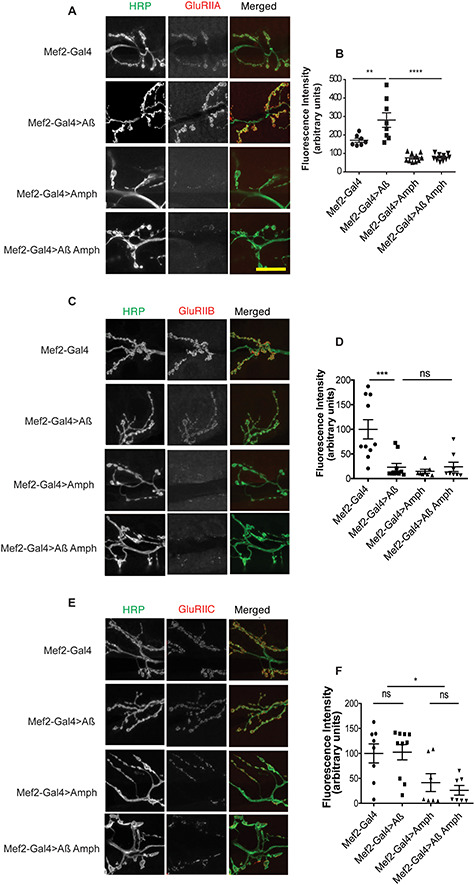
Amph effects GluRII localization. (A) Confocal images of the NMJ of wandering third-instar larvae expressing the Mef2-Gal4 driver alone (+/+; Mef2-Gal4/+), and Aβ (UAS-Aβ/+; Mef2-Gal4/+), Amph (Mef2-Gal4/UAS-Amph), or Aβ + lap (UAS-Aβ/+; Mef2-Gal4/UAS-Amph) driven by Mef2-Gal4, stained for GluRIIA. (B) Fluorescence intensity scores from (A) are plotted as means ± SEM, n > 7 per condition. F(3,31) = 25.04, P < 0.0001, determined by one-way ANOVA; **P < 0.01, ***P < 0.001, ****P < 0.0001, comparison by Tukey’s post hoc test. (C) GluRIIB fluorescence at the NMJ of wandering third-instar larvae expressing driver alone and Aβ, Amph or both driven by Mef2-Gal4 (genotypes as in A). (D) Fluorescence intensity scores from (C) are plotted as means ± SEM, n > 7 per condition. Scale bar, 20 μm. F(3,32) = 10.66, P < 0.001, by a one-way ANOVA; ***P < 0.001, ns, not significant, by Tukey’s post hoc test. (E) GluRIIC fluorescence at the NMJ of wandering third-instar larvae expressing driver alone, and Aβ, Amph or both driven by Mef2-Gal4 (genotypes as in A). (F) Fluorescence intensity scores from (E) are plotted as means ± SEM, n > 7 per condition. Scale bar, 20 μm. F(3,28) = 5.847, P = 0.0031 by one-way ANOVA; *P < 0.05, ns, not significant, by Tukey’s post hoc test.