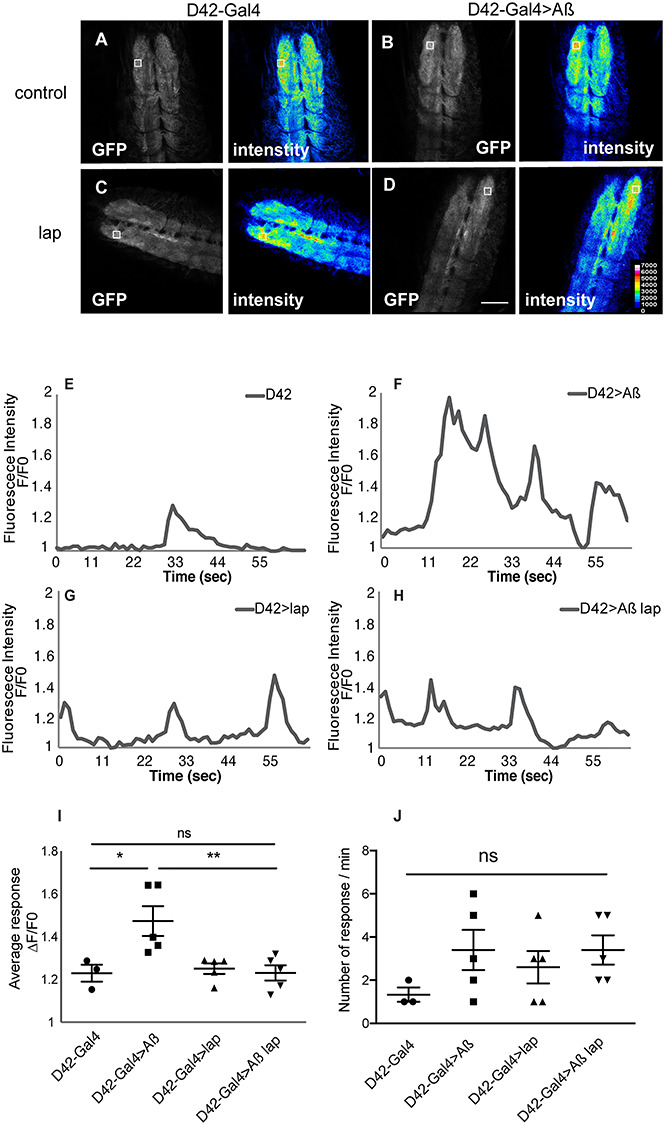
Figure 2.

Lap reduces excess glutamate release upon Aβ expression. (A–D) Single confocal images from movies of intact L2 larvae expressing iGluSnFR in neurons, showing local and transient increases in fluorescence reflecting the release of glutamate. The image is a representative burst of fluorescence from a movie (in grey) and an intensity map of the same frame (in colour). Genotypes: (A) D42-Gal4/UAS-iGluSnFR, (B) UAS-Aβ/+; D42-Gal4/UAS-iGluSnFR, (C) UAS-lap/+; D42-Gal4/UAS-iGluSnFR, (D) UAS-Aβ/UAS-lap; D42-Gal4/UAS-iGluSnFR. Scale bar, 20 μm. (E–H) Traces of changes in iGluSnFR fluorescence display the spontaneous activity in the neuropil. Fluorescence signals are normalized to minimum fluorescence in each trace and expressed relative to baseline. Genotypes are as above. The arrow indicates the time point shown in (A–D) (I) Quantification of the amplitude of the glutamate burst (described as changes in fluorescence relative to baseline) in the neuropil of L2 larvae shown in A–D, expressing driver alone with the reporter or together with Aβ, lap or both driven, plotted as means per animal ± SEM, n > 3 animals. Genotypes are as above. F(3,14) = 6.503, P = 0.0056, determined by one-way ANOVA; **P < 0.001, ns, not significant, comparison by Tukey’s post hoc test. (J) Quantification of the number of glutamate release events of the same larvae in (I), plotted as means ± SEM, n > 3 per condition. Genotypes: D42-Gal4/UAS-iGluSnFR, UAS-Aβ; D42-Gal4/UAS-iGluSnFR, UAS-lap; D42-Gal4/UAS-iGluSnFR, UAS-Aβ/UAS-lap; D42-Gal4/UAS-iGluSnFR. F(3,14) = 1.248, P = 0.3299, determined by one-way ANOVA; ns, not significant, comparison by Tukey’s post hoc test.
