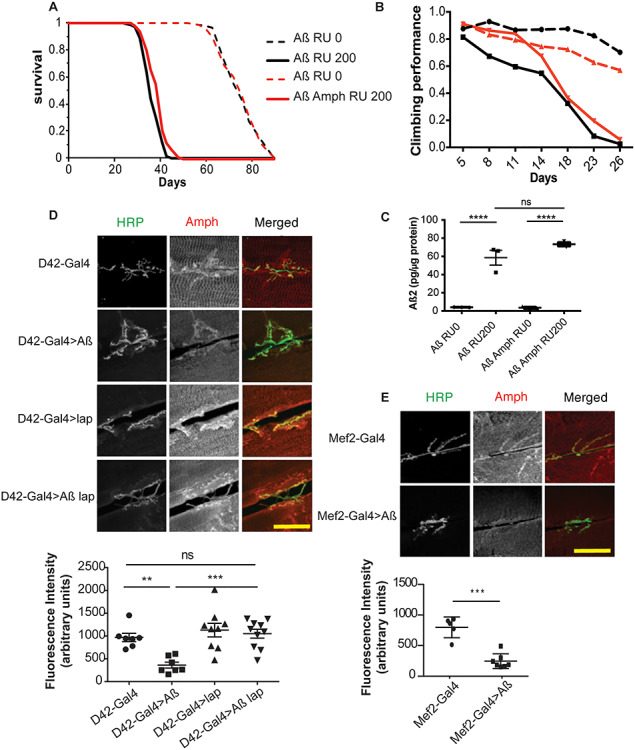
Figure 5.

Lap regulates Amph localization. (A) Survival curves of flies expressing Aβ, with (red lines, UAS-Aβ/UAS-Amph; elavGS/+) and without (black lines, UAS-Aβ/+; elavGS/+) lap co-overexpression, in adult neurons (RU200, solid lines) and uninduced controls (RU0, dashed lines). Expression of Aβ in neurons shortened lifespan, and lap co-overexpression significantly rescued this shortened lifespan. n > 145 per condition. Aβ RU0 versus Aβ RU200, P = 3.29E−73; Aβ RU0 versus Aβ Amph RU0, ns, not significant; Aβ Amph RU0 versus Aβ Amph RU200, P = 1.25E−82; Aβ RU200 versus Aβ lap RU200, P = 8.8E−7, determined by log–rank test. (B) Locomotor performance index of flies of the same genotypes as in (A). Aβ caused a climbing defect, which was significantly rescued by co-overexpression of Amph, n = ~50 flies per condition. There was a statistically significant interaction between RU and genotype by ordinal logistics, P = 1.0908E−12, indicating that expression of Amph significantly improved the climbing specifically of of Aß-expressing flies. (C) Aβ42 protein levels, measured by ELISA, in the heads of 21-day-old flies expressing Aβ with or without co-overexpression of Amph in neurons (RU200) and uninduced controls (RU0). Amph co-overexpression had no effect on Aβ42 levels. Means ± SEM, n = 3 biological replicates of 10 heads per replicate per condition. F(3,8) = 0.9406, P < 0.0001 by one-way ANOVA; ****P < 0.001, ns, not significant, comparison by Tukey’s post hoc test. (D) Confocal images and quantification of Amph fluorescence at the NMJ of wandering third-instar larvae expressing the D42-Gal4 driver alone (+/+; D42-Gal4/+), and Aβ (UAS-Aβ/+; D42-Gal4/+), lap (UAS-lap/+; D42-Gal4/+), or Aβ + lap (UAS-Aβ/UAS-lap; D42-Gal4/+) driven by D42-Gal4, plotted as means ± SEM, n > 7 per condition. Scale bar, 20 μm. F(3,29) = 8.954, P = 0.0002, determined by one-way ANOVA; **P < 0.01, ***P < 0.001, ns, not significant, comparison by Tukey’s post hoc test. (E) Confocal images and quantification of Amph fluorescence at the NMJ of wandering third-instar larvae expressing the Mef2-Gal4 driver alone (Mef2-Gal4/+) or Aβ driven by Mef2-Gal4 (UAS-Aβ/+; Mef2-Gal4/+), plotted as means ± SEM, n > 5 per condition. Scale bar, 20 μm. ***P < 0.001, comparison by Student’s test.
