
Figure 3.
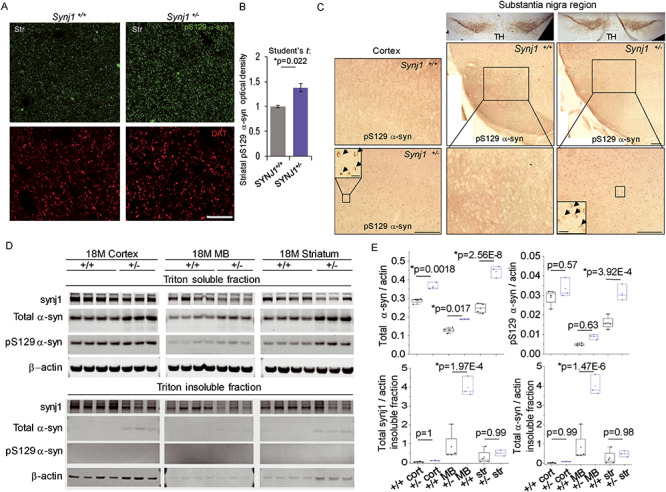
Increased total and phosphorylated alpha-syn levels in aged Synj1+/− mice. (A) Representative images from the striatum of Synj1+/+ and Synj1+/− mice immunolabeled with pS129 alpha-syn (green) and DAT (red). Scale bar: 200 μm. (B) Summary for the relative immunofluorescence (IF) intensity in the striatal slices from 18-month-old Synj1+/+ and Synj1+/− mice. Three images were taken at randomly selected areas of the striatum for each animal and a total of 3 male mice were analyzed. P-value is from two-sample Student’s t tests. (C) Representative immunohistochemical images of pS129 alpha-syn (DAB enhanced) from the cortex (left) as well as TH and pS129 alpha-syn (DAB enhanced) from the substantia nigra (right) of 18-months-old Synj1+/+ and Synj1+/− mice. Insets, high magnification images of the boxed areas in the corresponding Synj1+/− brain slices. Scale bars: 100 μm and 10 μm (inset). (D) Western blot for 18-month-old Synj1+/+ (N = 4) and Synj1+/− (N = 3) brains regions. Triton-soluble and -insoluble fractions were prepared from the same amount of brain homogenate for each brain region. Substantially larger pellets, enriched with alpha-syn and beta-actin, were obtained for all Synj1+/− samples compared with Synj1+/+ samples from the same brain region. (E) Quantitative analysis for total alpha-syn and pS129 alpha-syn in Triton-soluble as well as Triton-insoluble fractions (see Methods/alpha-synuclein analysis). All blots are repeated two to three times and the average was taken to represent the sample value. Two-way ANOVA was performed for genotype and brain region for all proteins analyzed. Significant difference was observed between Synj1+/+ and Synj1+/− mice for total alpha-syn (P = 2.56E-9), pS129 alpha-syn (P = 1.06E-4), insoluble synj1 (P = 0.0013) and insoluble alpha-syn (P = 3.02E-5). P-values shown in the box plots are from Tukey’s post-hoc analyses.