
Figure 4.
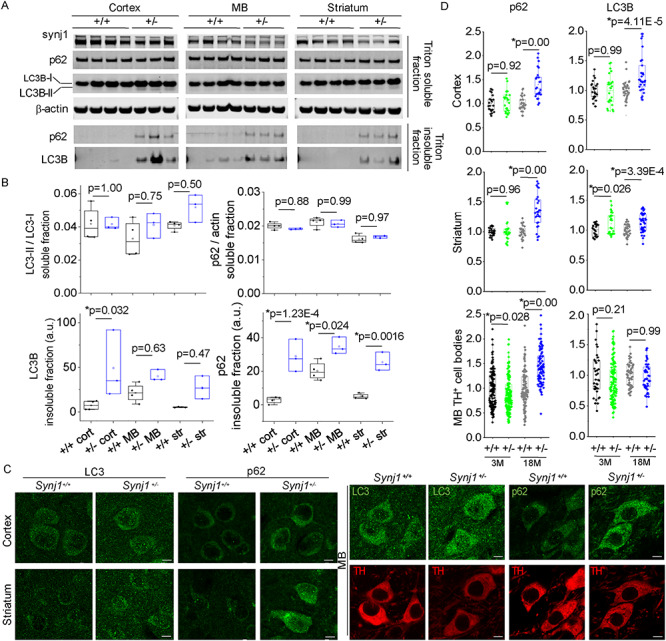
Impaired autophagy in aged Synj1+/− brains. (A) Western blots for 18-month-old Synj1+/+ (N = 4) and Synj1+/− (N = 3) brains regions. Blots from the same protein gel as the ones shown in Figure 3D. (B) Quantitative analysis for LC3B, p62, mTOR and pS2481 mTOR in Triton-soluble as well as Triton-insoluble fractions. Two-way ANOVA was performed for genotype and brain region for all proteins analyzed. P-values are from Tukey’s post-hoc analyses. (C) Representative confocal images of the 18-month cortex and striatum immunolabeled with LC3B or p62 (left) and images of the MB immunolabeled with either LC3 and TH or p62 and TH (right). Scale bar, 5 μm. (D) Summary for p62 and LC3B in the cortex and the striatum (measured by optical density) as well as those in the MB (measured by immunofluorescence at the TH+ cell bodies). Data from 10–20 images for each individual mouse, and three male mice were examined in each group. P-values are from Tukey’s post-hoc analyses following two-way ANOVA for age and genotype.