
Figure 5.
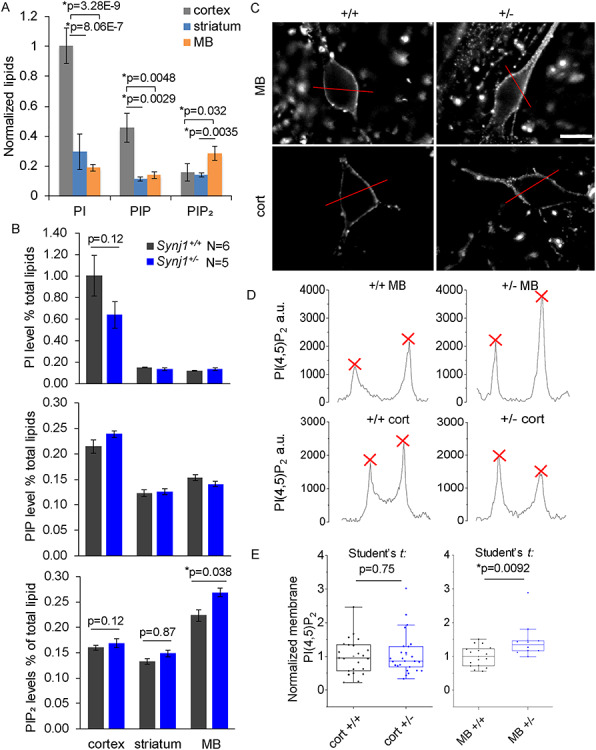
MB neuron-specific elevation of membrane PI(4,5)P2 in the Synj1+/− mice. (A) Comparison of phosphoinositide contents measured by HPLC in different brain regions (cortex, MB and striatum) of male wildtype mice at 12-months old (N = 17). One-way ANOVA was performed for each lipid across different brain regions. P-values are from Tukey’s post-hoc tests. (B) Summary of PI, PIP and PIP2 levels from 12-months-old Synj1+/− mice and Synj1+/+ mice. P-values are from Tukey’s post-hoc analyses following two-way ANOVA for each lipid. (C) Representative images of cultured MB and cortical neurons from Synj1+/+ mice and Synj1+/− mice immunolabeled with PI(4,5)P2. Red lines are representative selections used for profile plot for each cell. Scale bar, 20 μm. (D) Line profile plots for the four representative neurons in C. Red crosses are peak signals used for averaging and calculating membrane PI(4,5)P2 for the cell. (E) Summary of the relative membrane PI(4,5)P2 for different neurons normalized to the average of the Synj1+/+ neurons. Cort +/+ N = 23; Cort +/− N = 25; MB +/+ N = 16; MB +/− N = 10. P-values are calculated by two-sample Student’s t tests.