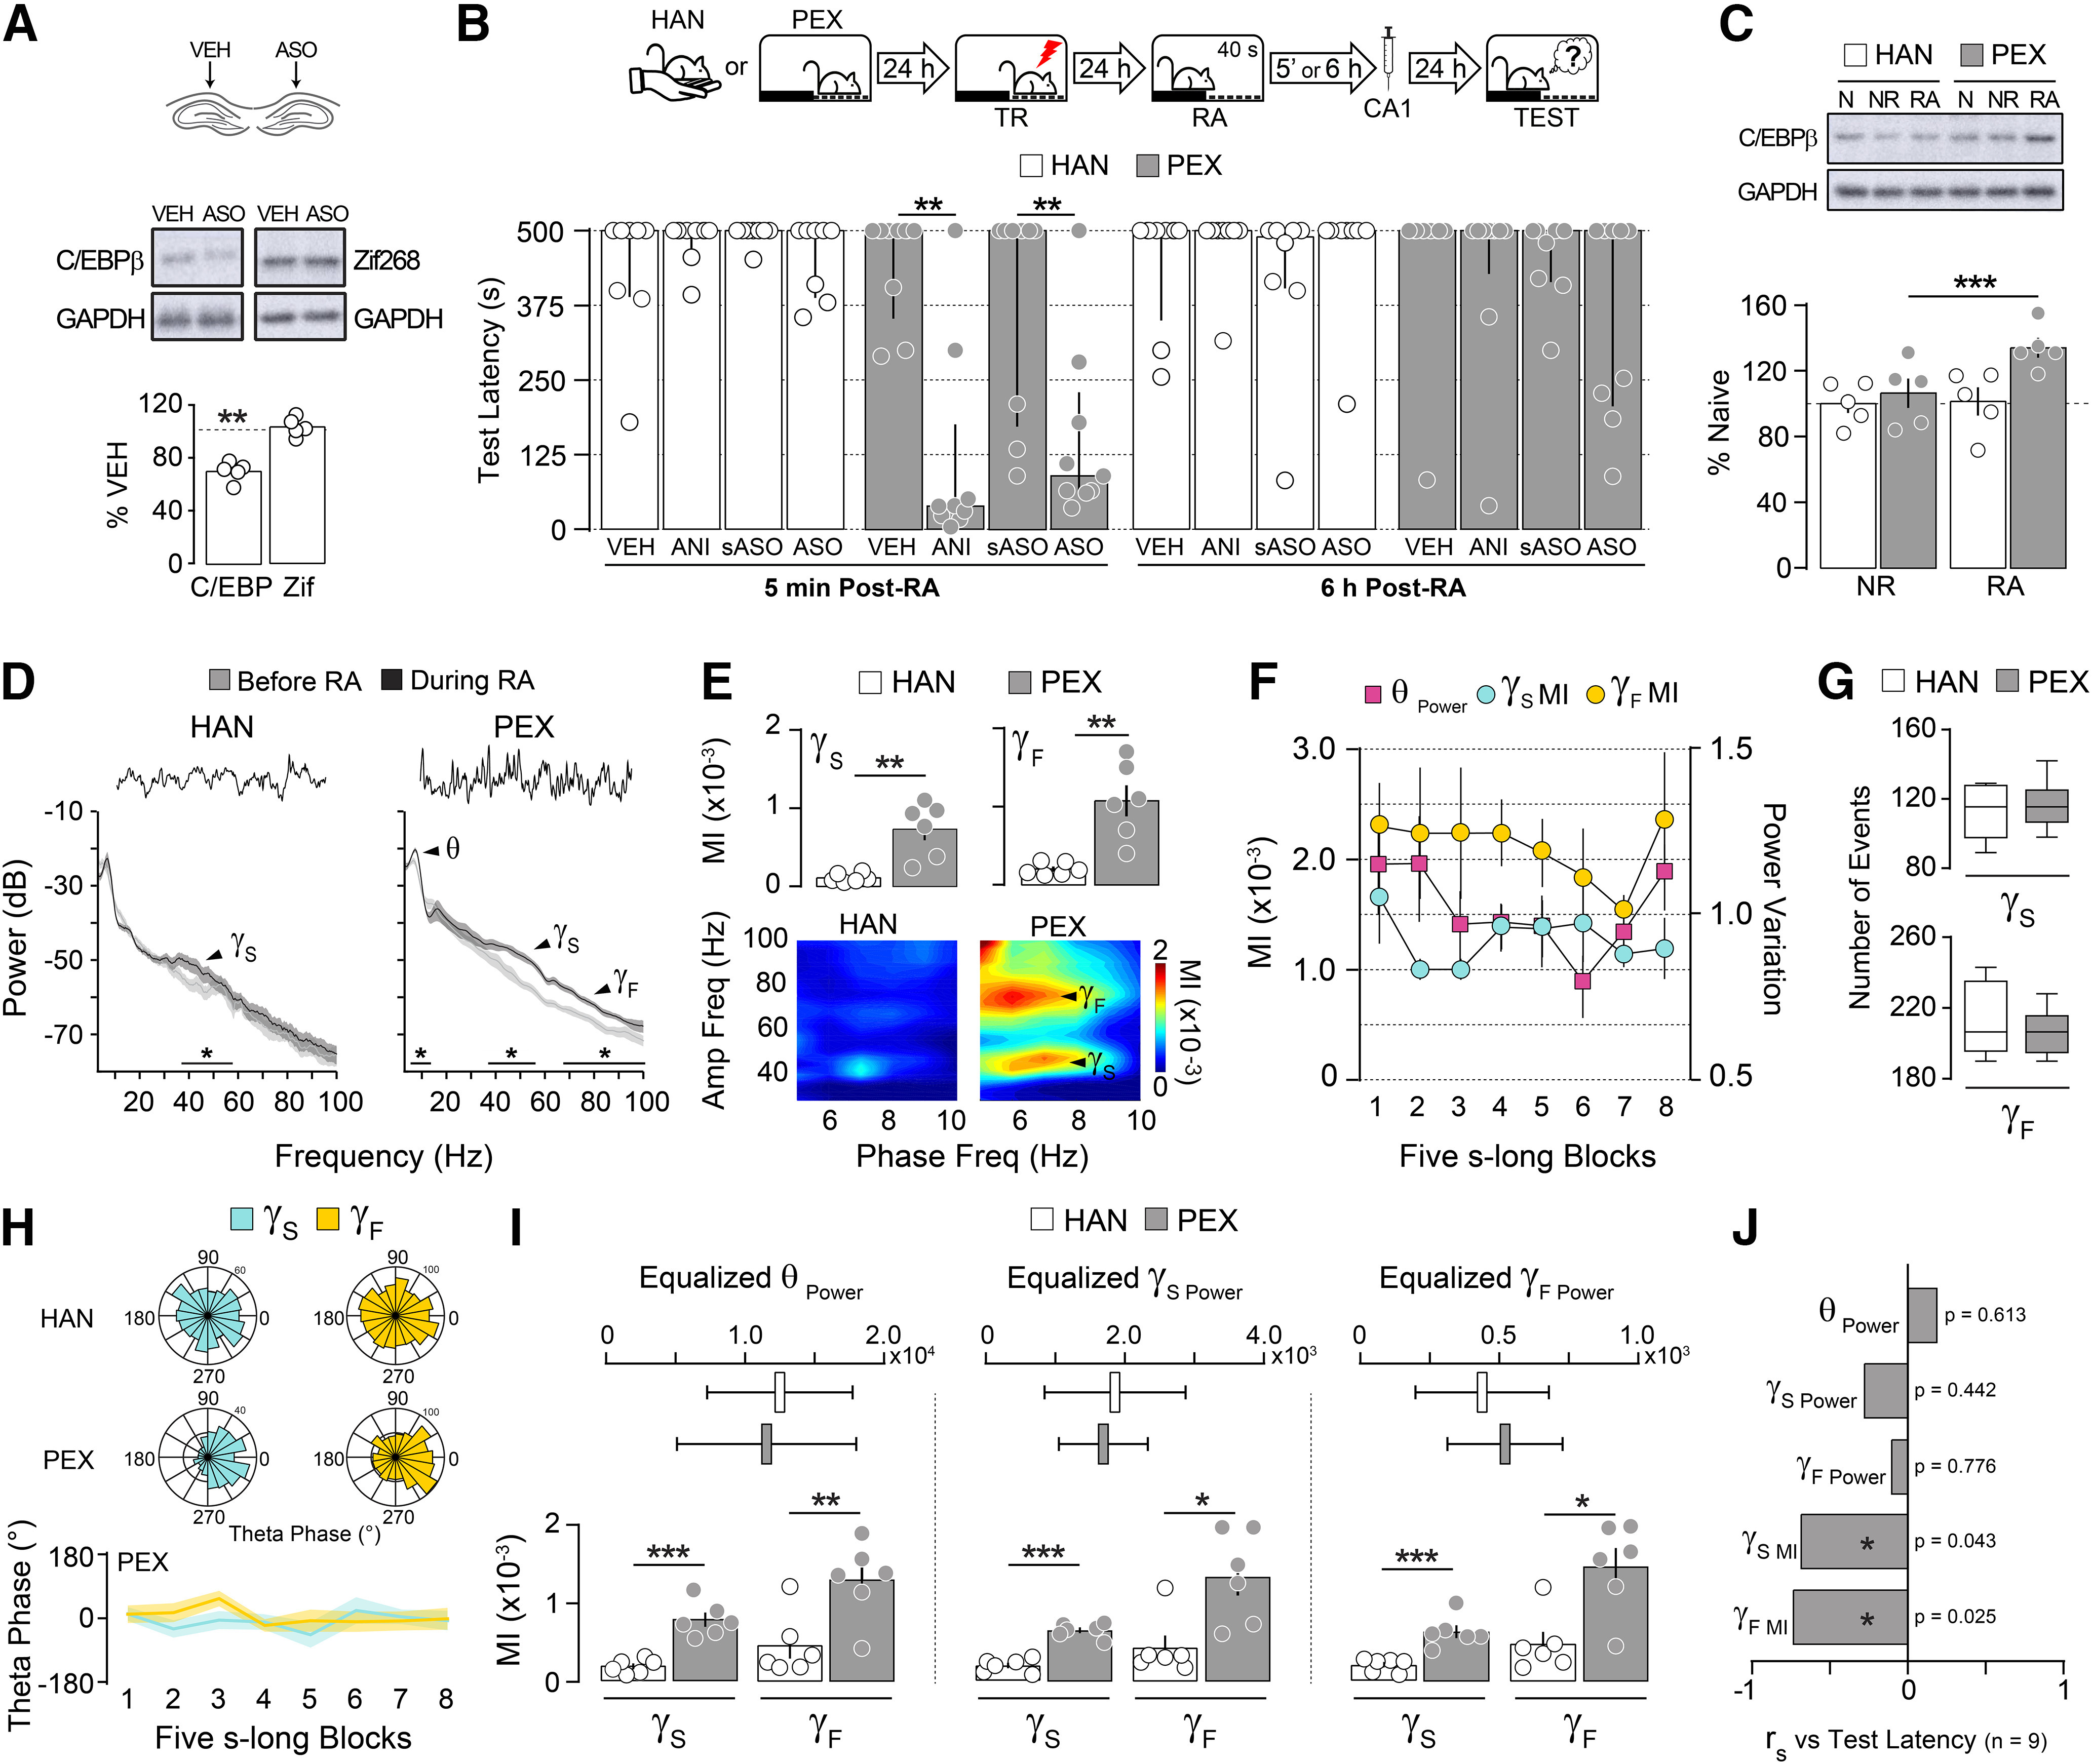
Figure 1.

Prior nonaversive learning is a boundary condition for hippocampus-dependent avoidance memory reconsolidation. A, Naive rats received VEH (0.9% saline) in the dorsal CA1 region of one hemisphere and C/EBPβ-ASO (2 nmol/µl) in the other. Ninety minutes later, the animals were decapitated, and the dorsal CA1 region was dissected out and homogenized to determine C/EBPβ, Zif268, and GAPDH protein levels by immunoblotting (n = 5/group). B, Rats were handled (HAN animals) or allowed to freely explore the SDIA training box (PEX animals) during 5 min once daily for 5 consecutive days. Twenty-four hours after the last handling or pre-exposition session, the animals were trained in SDIA (0.8 mA/2 s), and 1 d later submitted to a 40-s-long nonreinforced memory RA session. Five minutes or 6 h after RA, the animals received bilateral intradorsal CA1 infusions of VEH, ANI (160 µg/side), C/EBPβ-ASO (2 nmol/µl), or sASO (2 nmol/µl). Retention was evaluated 1 d later (TEST; n = 8–9/group). C, HAN and PEX animals were trained as in B, but 24 h after training they were handled during 40 s (NR) or submitted to RA, killed by decapitation 90 min thereafter, and the dorsal CA1 region was dissected out and homogenized to determine C/EBPβ and GAPDH protein levels by immunoblotting (n = 5/group). D, Representative raw hippocampal LFP traces and power spectrum density plots for HAN and PEX animals for theta (θ; 5–10 Hz), Sgamma (γS; 35–55 Hz), and Fgamma (γF; 65–100 Hz) frequency bands showing reactivation-induced alterations in hippocampal oscillatory activity (n = 6/group). E, Mean theta-Sgamma and theta-Fgamma MI and representative phase-amplitude comodulograms for HAN and PEX animals during RA. F, MI and theta power computed in eight nonoverlapping blocks throughout RA for PEX animals. G, Mean number of Sgamma and Fgamma events for HAN and PEX animals during RA. H, Gamma events distribution over theta phase for HAN and PEX animals during RA. 0° = theta peak. I, MIs calculated using epochs with equalized theta, Sgamma, or Fgamma power (expressed as μV2/Hz) for HAN and PEX animals during RA. J, SDIA-trained PEX animals with cannulas and electrode arrays implanted in the CA1 region of the dorsal hippocampus were submitted to RA, during which LFP signals were recorded. Five minutes after RA, the animals received VEH or ANI in dorsal CA1. Retention was evaluated 1 d later (median = 500, IQR = 379–500 for VEH; median = 78, IQR = 25–235 for ANI; U = 4.00, p = 0.0004 for VEH vs ANI in Mann–Whitney test; n = 9/group). Bar plots represent Spearman's r correlation coefficient between test latency and normalized theta power (θ Power; mean = 0.373, SEM = 0.026), Sgamma power (γS Power; mean = 0.087, SEM = 0.007), Fgamma power (γF Power; mean = 0.029, SEM = 0.003), theta-Sgamma MI (γS MI; mean = 0.479 × 10⁻³, SEM = 0.008 × 10⁻³) or theta-Fgamma MI (γF MI; mean = 0.728 × 10⁻³, SEM = 0.156 × 10⁻³) during RA for animals that received ANI. Data are expressed as the median ± IQR or mean ± SEM. *p < 0.05, **p < 0.01, ***p < 0.001.
