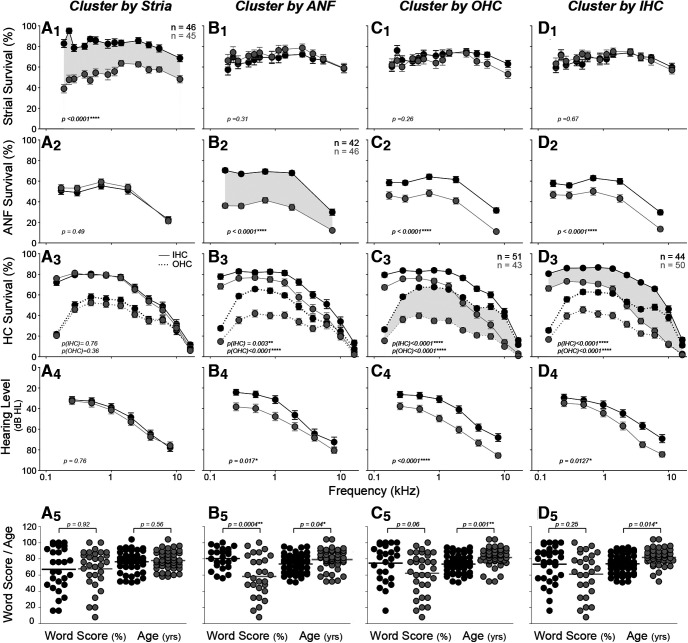
Figure 3.
Cluster analysis shows interactions among predictors and the contribution of each to hearing level and word scores. In each column, k-means clustering was performed based on fractional survival of a different histologic metric, as indicated in the header: A1–A5, stria; B1–B5, ANF; C1–C5, OHCs; and D1–D5, IHCs. Clustering was adjusted to define two groups of approximately equal size, as shown by the paired functions separated by gray shading (n values are group sizes). For the top three rows, mean values (±SEMs) are shown for the histologic metric indicated on the y axis at the left. The bottom two rows represent the outcomes for each cluster: means (±SEMs) for audiograms (A4, B4, C4, D4) and dot plots for word scores (A5, B5, C5, D5). Ages are shown in the bottom row, along with statistics for the pairwise comparisons: Student's t test for the bottom row; profile analysis for the top three rows. The dataset for hair cell counts includes all cases older than 50 years (n = 94: 58 M, 36 F); strial measurements were impossible in 3 cases because of gross portmortem artifact (n = 91: 57 M, 34 F), and ANF counts were impossible in 6 cases because of faint staining (n = 88: 57M, 31F).

