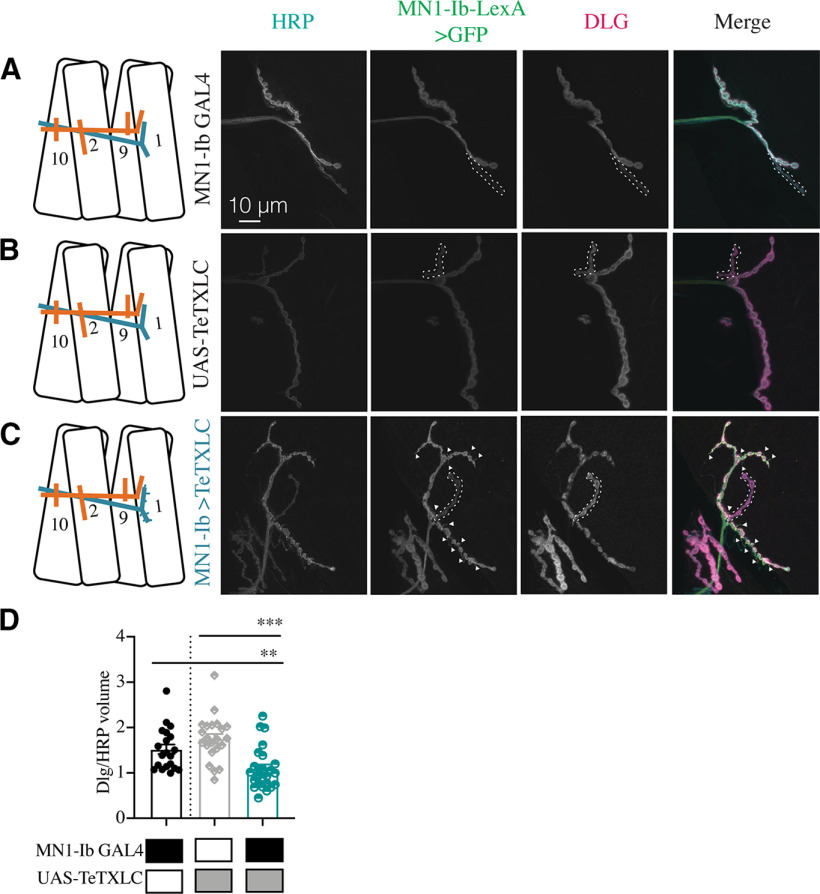
Figure 12.
Reduced postsynaptic SSR volume following silencing of MN1-Ib. A–C, Representative confocal images of third instar larval M1 NMJs at segment A3 following immunolabeling with anti-HRP, anti-GFP, and anti-DLG in the following genotypes: MN1-Ib GAL4 control (A); UAS-TeTXLC control (B); and MN1-Ib GAL4>UAS-TeTXLC (C). MN1-Ib LexA>LexAop2-CD8-GFP was present in each genetic background to allow unambiguous identification of the Ib terminal. Diagrams of the experimental manipulation are shown on the left, with MN1-Ib (teal) and MNIs (orange) labeled. The merged image is shown on the right. The white dashed line highlights the MNIs terminal in the final three panels for each manipulation. Arrowheads in C depict GFP-positive filopodial-like projections from MN1-Ib following tetanus toxin expression. Scale bars: all panels, 10 µm. D, Quantification of DLG to HRP volume in MN1-Ib in controls and following UAS-TeTXLC expression with MN1-Ib GAL4. Each data point represents quantification from segment A3 M1 from a single third instar larvae. Statistical significance was determined using ANOVA. Data are shown as the mean ± SEM. **p < 0.01, ***p < 0.001.

