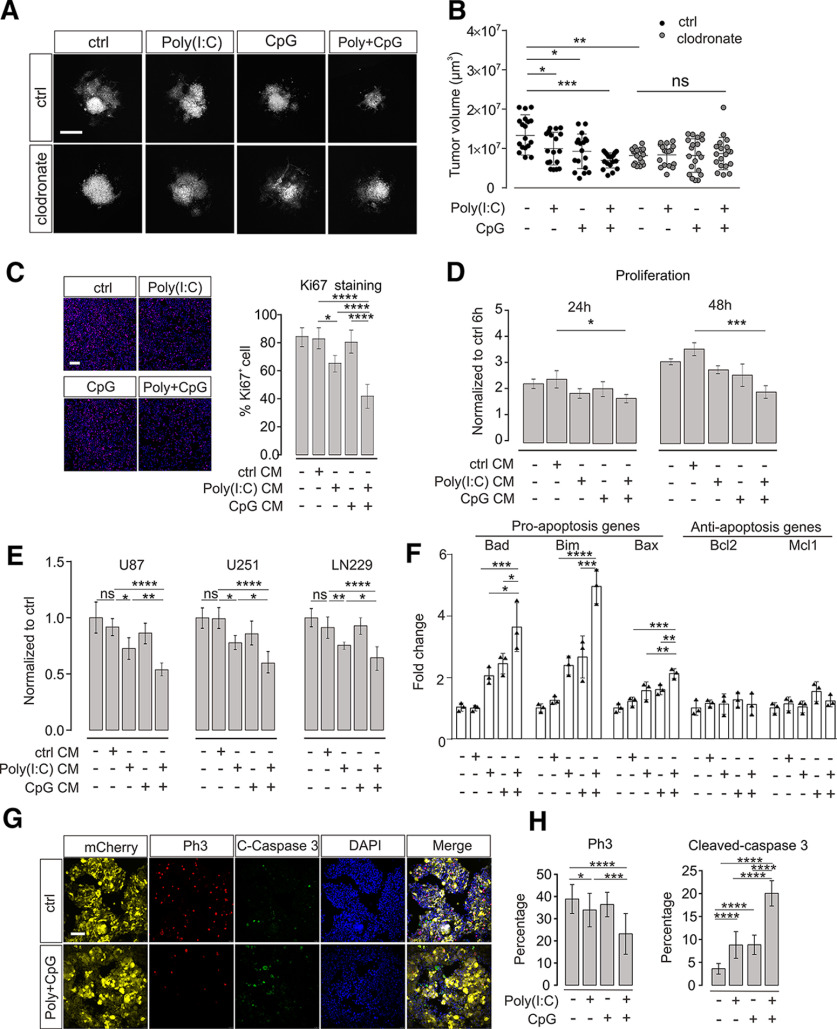
Figure 1.
TLR3 and TLR9 costimulation impairs glioma growth mediated by microglia. A, OBS cultures were inoculated with GL261mCherry cells and treated with Poly(I:C), CpG, orPoly(I:C) + CpG compared with untreated control (ctrl). We compared slices with microglia (ctrl) with slices depleted of microglia by clodronate. Representative images of mCherry labeling are shown after 120 h of glioma growth. Scale bar, 500 μm. B, Tumor volumes in slices described in A were quantified by confocal microscopy with z-stack scanning and 3D reconstruction. C, Proliferation of GL261 glioma cells was determined by ki67 immunofluorescence staining after 48 h of treatment with medium conditioned by microglia (CM). Cultured microglia were stimulated with 10 μg/ml Poly(I:C), 2 µM CpG, or Poly(I:C) + CpG for 24 h compared with an unstimulated control (ctrl). After medium change, cells were maintained for another 24 h, and resulting conditioned medium was used to tumor cell incubation. Left, Images of samples. Right, Quantification of Ki67 staining. Scale bar, 50 μm. n = 5 per group. D, Proliferation rate of GL261 glioma cells was determined using CCK-8 cell counting kit. Glioma cells were treated as described in C for 24 and 48 h. Data are normalized to proliferation rate measured after a 6 h treatment with control medium from unstimulated microglia; n = 3 per group. E, Three different human glioma cell lines (i.e., U87, U251, and LN229) were treated for 24 h with medium harvested from THP1 cells treated with a similar paradigm as described in C. Proliferation rate of glioma cells was measured with CCK-8 cell counting kit assay and normalized to control stimulation; n = 6 per group. F, qPCR was used to evaluate both proapoptosis marker and antiapoptosis marker expression levels after 48 h treatment of GL261 glioma cells with supernatant harvested from microglia. Microglia were treated with the same paradigm as described in C. G, OBCs were inoculated with GL261mCherry cells. Yellow represents mCherry labeling. Immunofluorescence labeling with Ph3 (red), cleaved caspase-3 (green), and DAPI (blue). Right, The image in which all labeling is merged. Slices were either untreated (top row, Ctrl) or treated with Poly(I:C) + CpG (bottom row). Scale bar, 50 μm. H, Quantification of Ph3 (left) and cleaved caspase-3 (right) immunofluorescence after treatment with 10 µg/ml Poly(I:C), 2 µM CpG, or 10 µg/ml Poly(I:C) +2 µM CpG compared with untreated slices. C-Caspase 3 = cleaved-caspase 3. ns = no significance. *p < 0.05, **p < 0.01, ***p < 0.001, ****p < 0.0001.

