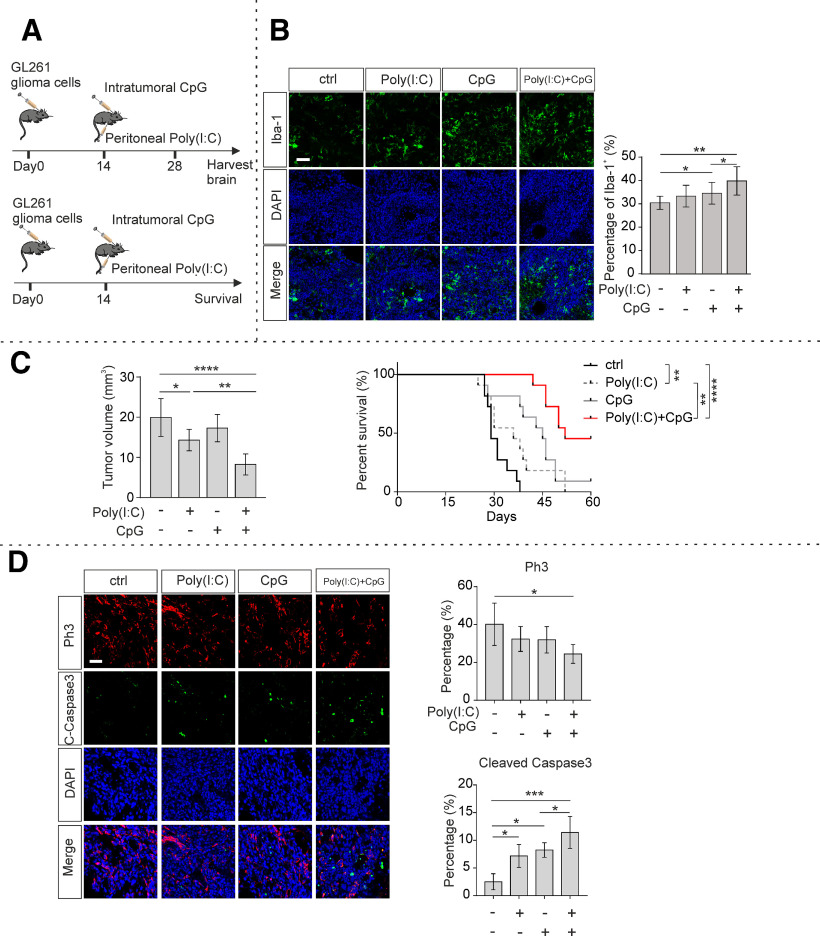
Figure 6.
TLR3 and TLR9 synergistically suppress tumor growth in vivo. A, Scheme represents the experimental paradigms of the glioma-injected and treated mice. Top, The survival experiment. Bottom, The determination of glioma volume and tissue analysis. Mice were inoculated with GL261 cells and peritoneally injected with 200 µg Poly(I:C) every 3 d and intratumorally injected with 100 µg CpG every 7 d. B, Twenty-eight days after tumor inoculation, slices were prepared and Iba-1 (green) immunofluorescence staining was used to label microglia/macrophages, DAPI (blue) for labeling nuclei. Bottom row represents the merged labeling. Left, Representative figures. Right, Quantification of Iba-1+ cells (n = 4 per group). Scale bar, 50 μm. C, Left, Twenty-eight days after tumor inoculation, slices were prepared, and tumor volumes were quantified by H&E staining and based on unbiased stereology (n = 6 per group). Right, Kaplan–Meier curves represent the cumulative survival of tumor mice with the different treatment paradigms (n = 11 per group). D, Left, Immunohistochemical labeling of glioma containing slices from mice killed 28 d after tumor inoculation. Top two rows represent proliferation marker Ph3 (red) and apoptosis marker cleaved caspase-3 (C-caspase3, green). Third row represents nucleus marker DAPI. Fourth row represents a merge of the three rows. Scale bar, 50 μm. Right, Immunofluorescence labeling of Ph3 and cleaved caspase-3 was quantified by measuring the fluorescence signal subsequently normalized to DAPI. *p < 0.05, **p < 0.01, ***p < 0.001, ****p < 0.0001.

