Figure 6.
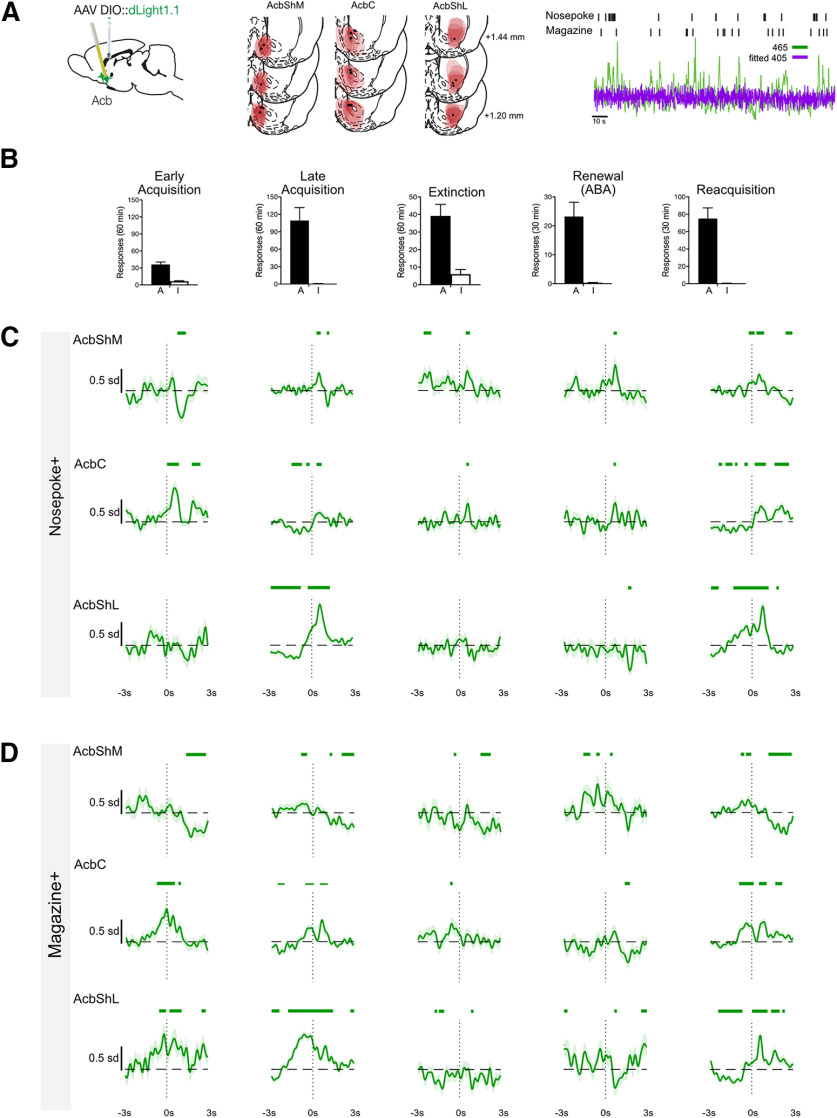
Dopamine transients in the ventral striatum. A, dLight was applied to AcbShM, AcbC, or AcbShL, and rats were trained and tested in an ABA renewal procedure and for reacquisition. A representative recording trace is shown. Location of dLight1.1 expression and fiber tips in Acb with each rat represented at 25% opacity. B, Mean ± SEM active (A) and inactive (I) nosepokes from the five recording sessions. C, Mean ± SEM normalized dopamine transients ±3 s around Nosepoke+. Green bars above traces represent periods (with minimum consecutive threshold) of significant difference from 0 as defined by 95% CIs. D, Mean ± SEM normalized dopamine transients from –3 s to 3 s around Magazine+ for AcbShM, AcbC, AcbShL. Green bars above traces represent periods (with minimum consecutive threshold) of significant difference from 0 as defined by 95% CIs.

