
Figure.
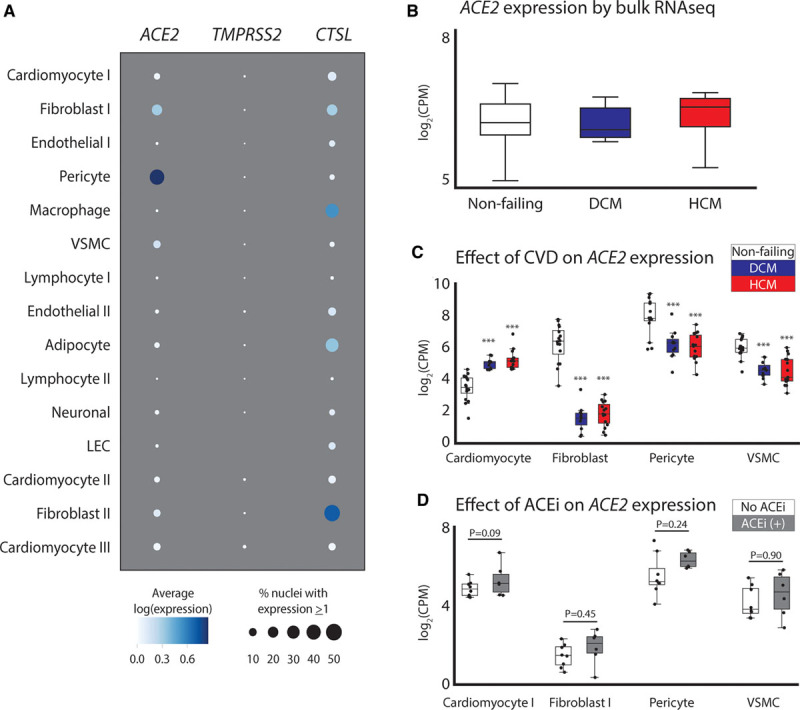
Assessment of ACE2 expression in the human myocardium. A, Dot plot representing the relative expression of ACE2, CTSL, and TMPRSS2 in the left ventricle. Size and hue of the dot indicates the percent of nuclei expressing and the mean of the log-transformed, normalized counts for all nuclei in each cell type. B, Expression of ACE2 by bulk RNA-Seq from nonfailing, dilated cardiomyopathy (DCM), and hypertrophic cardiomyopathy (HCM) ventricles. C, Single nucleus RNA-Seq from the same tissue samples as in B with mean expression of ACE2 in cell subtypes with appreciable expression. D, Effects of angiotensin-converting enzyme inhibitors (ACEis) on ACE2 expression across cell types in individuals with HCM. Boxes represent 25% to 75% and whiskers represent the minimum–maximum range, excluding outliers. ***P<0.001. CVD indicates cardiovascular disease; LEC, lymphatic endothelial cell; and VSMC, vascular smooth muscle cell.