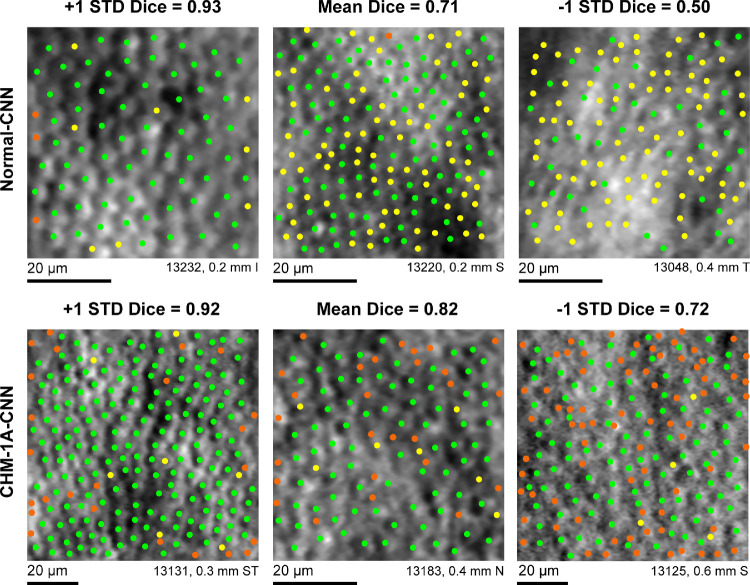
Figure 5.
Automated cone identifications from CNN in comparison to manual cone selections by an experienced grader. Green dots show cones that were identified by both the CNN and by grader 1A. Yellow dots show cone locations selected by grader 1A but not the CNN. Orange dots show cone locations that were selected by the CNN but not by grader 1A. Top row: normal-CNN; bottom row: CHM-1A-CNN. The three images shown are the images corresponding to the mean and the mean ± 1 SD Dice coefficient for each CNN training condition. I = inferior, N = nasal, S = superior, T = temporal.

