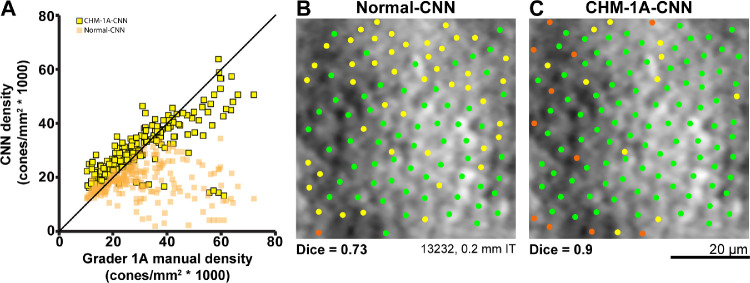
Figure 6.
(A) Cone density calculations resulting from the CNN (normal-CNN, orange squares; CHM-1A-CNN, yellow squares with black outline) automated cone identifications versus the cone densities calculated from the first set of manual cone identifications made by grader 1. The normal-trained network's cone identifications resulted in lower cone densities than the manual grader. The CHM-trained network resulted in higher cone densities than the manual grader for low density images, but lower cone densities than the manual grader for high density images. The CHM-trained network always results in a higher calculated cone density than the normal-trained network. The black line shows the line of equivalence. (B, C) Automated cone identifications from the normal and CHM-trained CNNs for the same image. Green dots show cones that were identified by both the CNN and by grader 1A. Yellow dots show cone locations selected by grader 1A but not the CNN. Orange dots show cone locations that were selected by the CNN but not by grader 1A. B Normal-CNN; C CHM-1A-CNN. The CHM-trained CNN showed a higher number of true positives and a higher number of false positives compared to the normal-trained network. The ROI shown in the figure had the mean difference in cone density between the CHM and normal trained networks. I = inferior, T = temporal.

