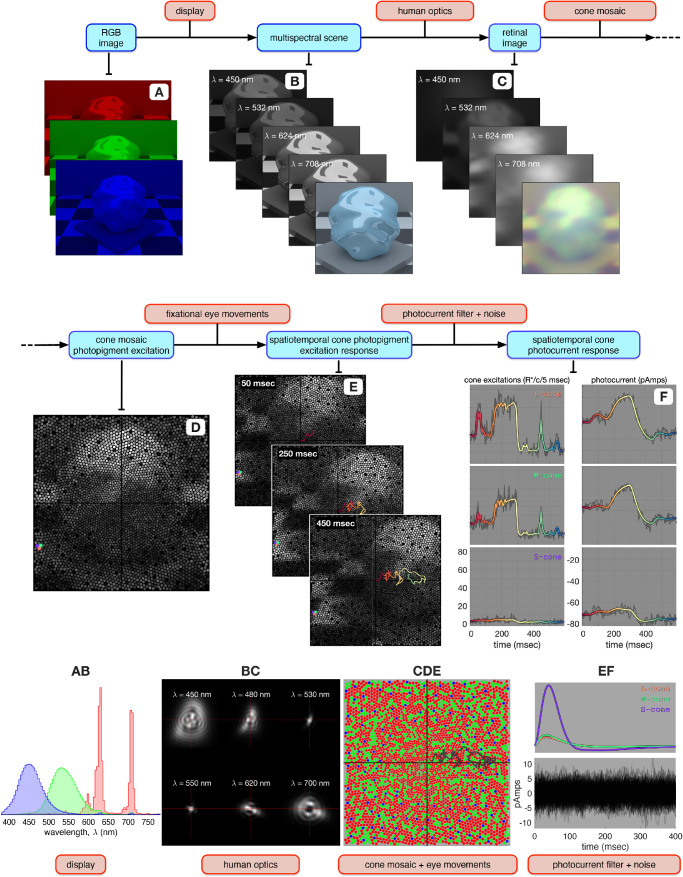
Figure 1.
Flowchart of ISETBio computations. (A) The visual stimulus, here an image on an RGB display. (B) The corresponding multispecral scene, consisting of a spectral stack of spatial radiance maps at the sample wavelengths. The image at the front of the stack represents an RGB rendition of the scene. The A → B computation uses the spectral power distributions of the display primaries (panel AB). (C) The corresponding retinal image for a single fixation location, consisting of a spectral stack of spatial irradiance maps at the sample wavelengths. The image at the front of the stack represents an RGB rendition of the retinal image. The yellow tint is due to spectral filtering by the lens. The B → C computation blurs the scene radiance using a set of shift-invariant point spread functions (panel BC), typical of human foveal vision. (D) The corresponding cone mosaic photopigment excitation response, also at a single fixation location. The pink, cyan, and magenta disks highlight an L-, an M-, and an S-cone, respectively. The C → D computation uses an eccentricity-based cone mosaic model (panel CDE) in which L- (red disks), M- (green disks) and S- (blue disks) cones spectrally integrate and spatially sample the retinal irradiance. (E) Spatiotemporal cone photopigment excitation response depicted as a temporal stack of cone mosaic photopigment response maps. The temporal dynamics introduced in the D → E computation are due to fixational eye movement paths generated via a human ocular drift model, which translates the retinal image with respect to the cone mosaic. The color coded line superimposed in panel E depicts eye position during a 600-ms long fixational eye movement trajectory, with color changing from red to yellow to green to blue, as time increases from 0 to 600 ms. (F) Conversion of noise-free photopigment excitation responses during the fixational eye movement trajectory (color-coded lines in the left panels) to noise-free photocurrent responses (color-coded lines in the right panels) for the three selected cones. This computation uses biophysically-derived photocurrent impulse responses which depend on the mean cone excitation level (top panel of EF). Gray lines in the left and right panels depict noisy instances of the corresponding cone photopigment and cone photocurrent responses. 256 instances of photocurrent noise are depicted in the bottom panel of EF.

