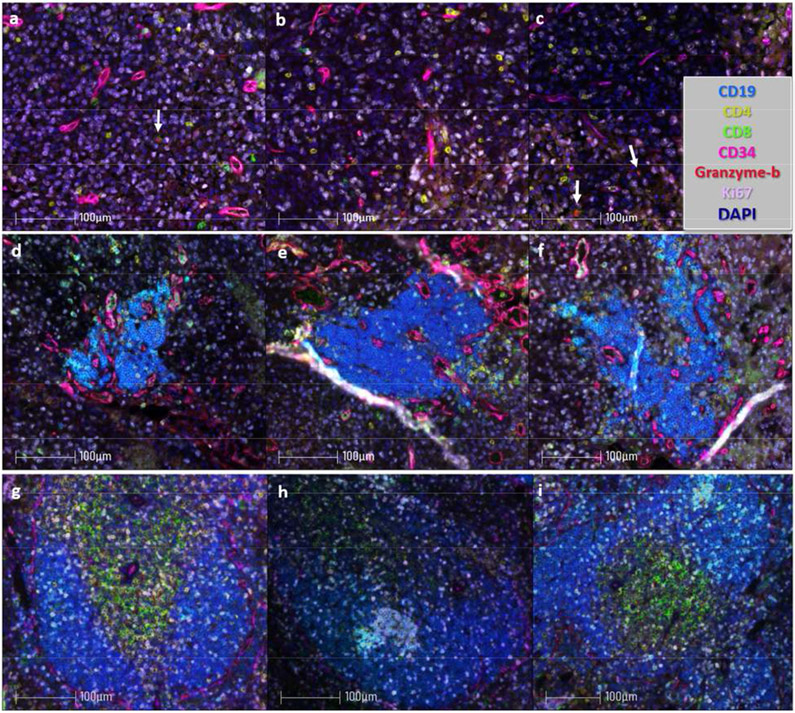
Figure 2:
Paraffin embedded tissue specimens were sectioned and stained for immunofluorescent microscopy as outlined in Sections 3.1-3.3. Tumor sections were stained with the antibodies and Opals detailed in Table 2. Images were acquired at 20x and spectrally compensated in the Inform Program (PerkinElmer) using single stain positive controls. (a-c) Spectrally compensated images from a single GL261-luc2 (glioblastoma) intracranial tumor; arrows denote CD8+granzyme-b+ tumor infiltrating cells. (e-f) Images from B16-OVA (melanoma) intraperitoneal tumors which harbor TLS. (g-h) Images from murine spleen. Scale bar = 100 μm.

