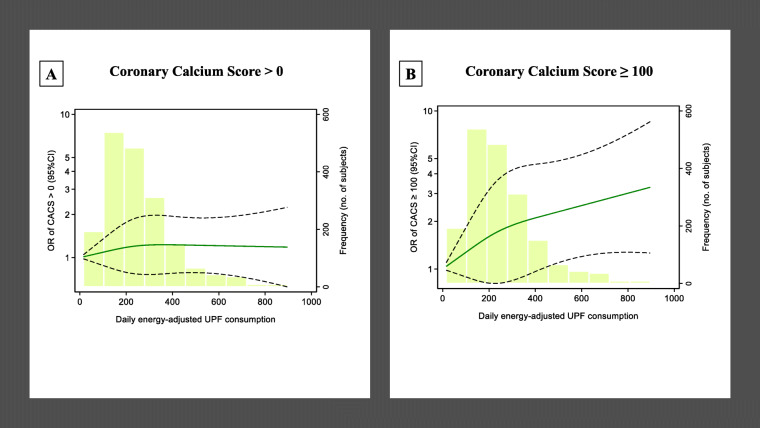
Fig. 2.
Restricted cubic splines for the association of Coronary Artery Calcium (CACS) and ultra-processed food (UPF) consumption, in the AWHS cohort study (N = 1876). The standard binary logistic regression was used to perform restricted cubic splines with 3 knots of the distribution (at the 10th, 50th, and 90th percentiles of the distribution). Participants with an exposure above the 99th percentile were not included. Dashed lines represent 95% CIs. The histograms show the distributions of energy-adjusted ultra-processed food consumption. a The odds of CACS > 0 (p value of the Wald test for non-linearity is 0.59) and b the odds of CACS > 100 (p value of the Wald test for non-linearity is 0.029) as ultra-processed food consumption increases. Models adjusted for age, marital status, education, smoking, physical activity, sleep duration during weekdays and during the weekend, alcohol consumption, total fiber intake, cholesterol intake, total energy intake, and cardiovascular risk factors: total serum cholesterol, HDL serum cholesterol, systolic and diastolic blood pressure, body mass index, and diabetes. AWHS, Aragon Workers’ Health Study; CACS, Coronary Agatston Calcium Score; UPF, ultra-processed food; OR, odds ratio; CI, confidence interval

