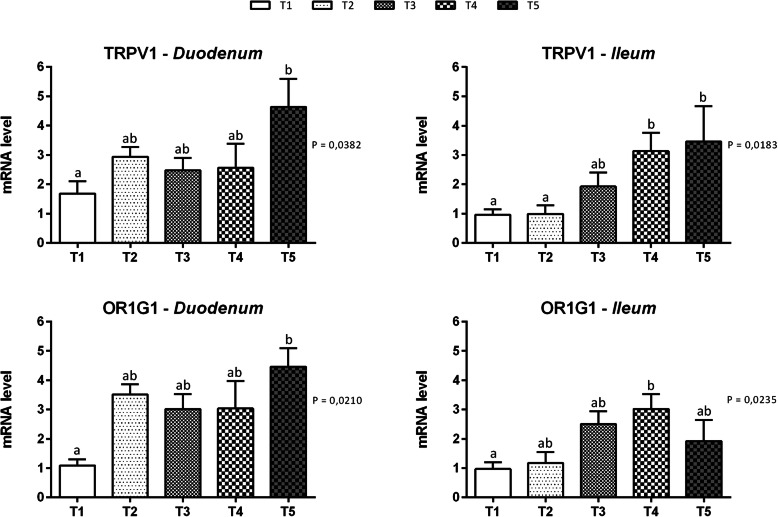
Fig. 3.
Gene expression of chemosensory receptors in duodenal and ileal mucosa of piglets. Data are expressed as means (n = 8) and S.E.M. represented by vertical bars. a,b Values with different superscripts differ significantly at P < 0.05. T1 = basal diet; T2 = basal diet + 25.5 mg of thymol/kg feed; T3 = basal diet + 51 mg of thymol/kg feed; T4 = basal diet + 153 mg of thymol/kg feed; T5 = basal diet + 510 mg of thymol/kg feed (Vetagro SpA, Reggio Emilia, Italy). A modification of the 2–ΔΔCT method was used to analyze the relative expression (fold changes), calculated relative to the control group (control; Livak and Schmittgen, 2001 [21]). TRPV1 = transient receptor potential vanilloid 1; OR1G1 = Olfactory receptor 1G1

