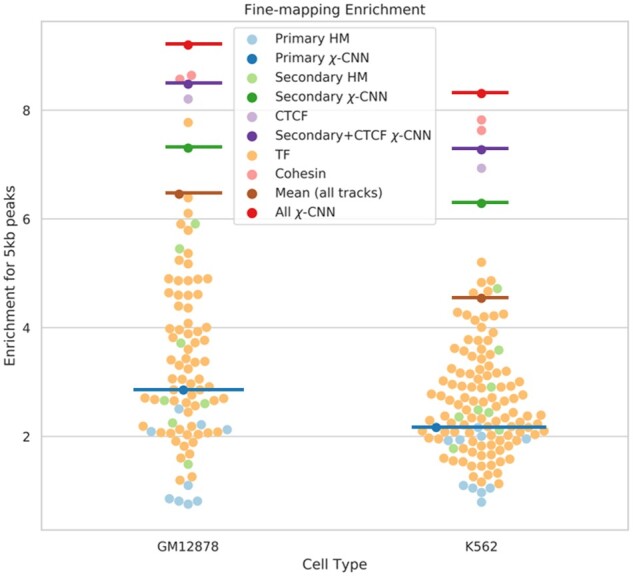
Fig. 4.

The 5 kb peak fine-mapping performance for χ-CNN and baseline methods. Fine-mapping performance using individual features is marked with points, and methods integrating multiple features are emphasized with horizontal bars. Light blue points and the dark blue bar correspond to ‘primary’ histone marks and χ-CNN trained on these marks, respectively. Similarly, light green points and the dark green bar correspond to ‘secondary’ marks. CTCF, in lavender, performs well, but χ-CNN trained on ‘secondary’ marks and CTCF performs better. Cohesion sub-units, in pink, are the best performing single marks; however, χ-CNN trained on all features, in red, shows greater enrichment than any individual mark. All other TFs, in orange, perform similarly to histone marks. Finally, a baseline method of averaging all features is marked with a brown bar. (Color version of this figure is available at Bioinformatics online.)
