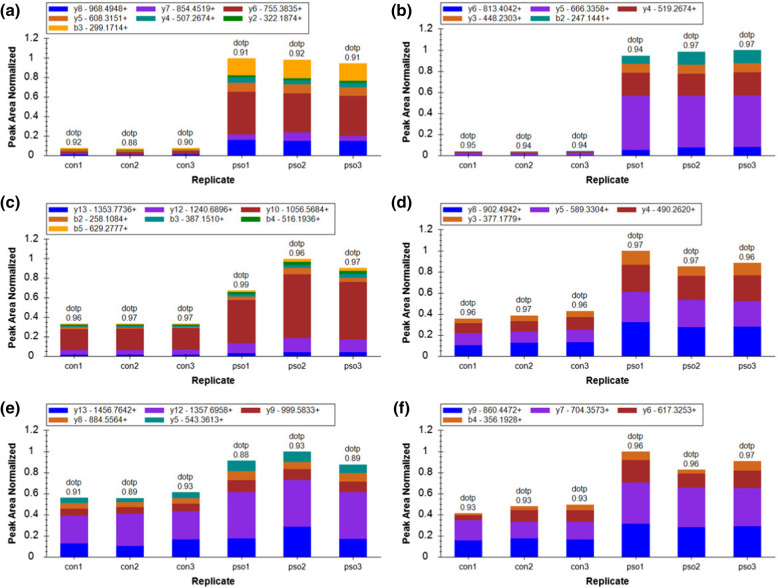
Fig. 5.
The PRM peak area of the selected DEPs. a Ion peak area distribution of the IANVFTNAFR fragment corresponding to MPO protein. b Ion peak area distribution of the VFFASWR fragment corresponding to MPO protein. c Ion peak area distribution of the EQEELLAPADGTVELVR fragment corresponding to TYMP protein. d Ion peak area distribution of the ALQEALVLSDR fragment corresponding to TYMP protein. e Ion peak area distribution of the LPIVNEDDELVAIIAR fragment corresponding to IMPDH2 protein. F. Ion peak area distribution of the VAQGVSGAVQDK fragment corresponding to IMPDH2 protein

