Fig. 2.
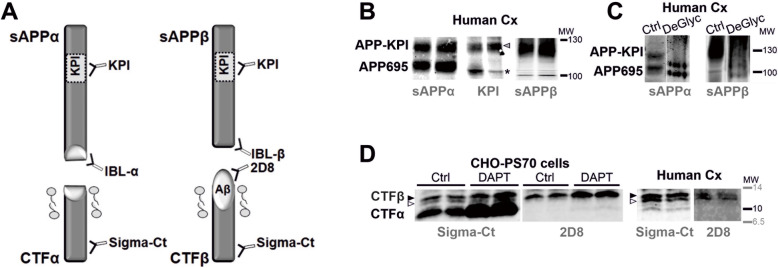
Biochemical characterization of APP-NTF and CTF fragments in frontal cortex extracts. a Schematic representation of the sAPPα, sAPPβ, CTFα and CTFβ proteolytic fragments generated by α-secretase (non-amyloidogenic pathway) and β-secretase (amyloidogenic pathway) (not drawn to scale). The localization of the KPI domain in APP751 and APP770 variants, but not in APP695, is indicated. The epitopes for the antibodies used in this study are also shown. b To assess the identity of the higher molecular mass sAPPα and sAPPβ species derived from KPI variants, the same two frontal cortex extracts were run in parallel and probed separately with an antibody against sAPPα or sAβPPβ, as well with an antibody against KPI (for a simultaneous analysis of fluorescence with the mouse anti-sAPPα antibody combined with the rabbit anti-KPI antibody: see Supplemental Fig. 2). The arrowhead indicates the KPI band that matches with the sAPPα and/or sAPPβ species, and (*) indicates the band immunoreactive for KPI but that does not match with the APP bands detected with anti-sAPPα or sAPPβ antibodies (see comments in Result section). c Aliquots of the frontal cortex extracts were also incubated with a cocktail of N- and O-linkage specific glycosidases, Sialidase A (deGlyc) or the vehicle alone as a control (Ctrl), and then analyzed in western blots probed with specific sAPPα or sAβPPβ antibodies (for a simultaneous analysis of fluorescence see Supplemental Fig. 2B). Representative blots are shown. d To characterize CTFα (C83) and CTFβ (C99 and C89), CHO-PS70 cells treated with the γ-secretase inhibitor DAPT or the vehicle alone (Ctrl) were analyzed in parallel to control brain extracts (human frontal cortex: Human Cx). Immunoblots of CHO-PS70 extracts were probed simultaneously with two different antibodies: the rabbit C-terminal antibody common to CTFα and CTFβ; and the rat antibody 2D8 raised against the N-terminal domain of Aβ that therefore only detects CTFβ (see also Supplemental Fig. 2D). The closed arrowhead indicates the specific band assigned to C99 CTFβ, which accumulates in cells treated with DAPT, while the open arrowhead indicates the band assigned to C89 CTFβ. The approximate localizations of the molecular weight (MW) markers are shown

