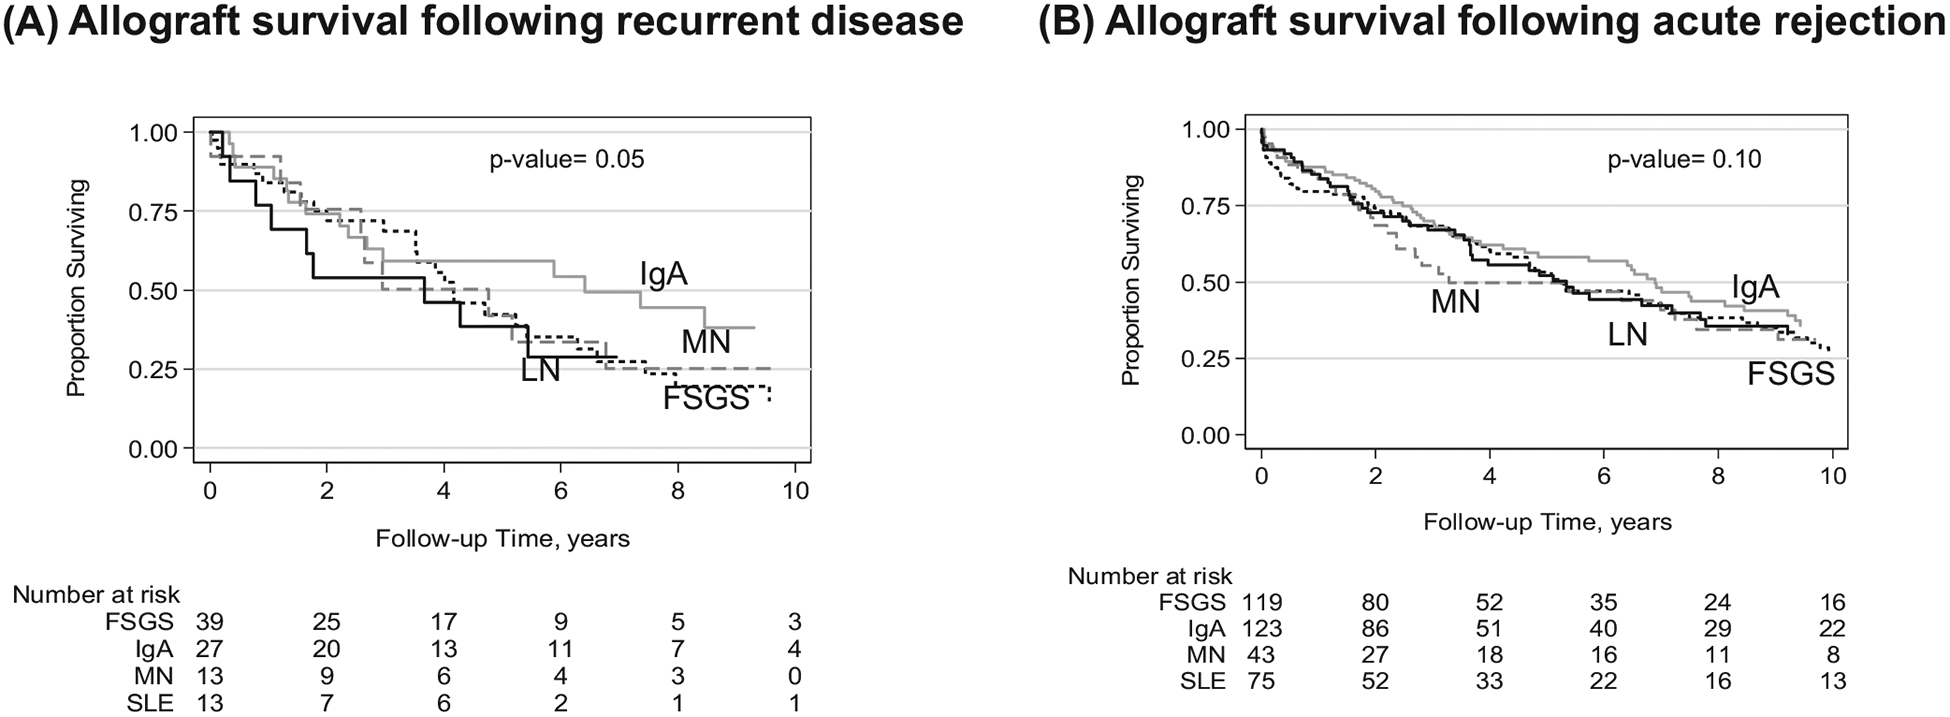
FIGURE 4.

Kaplan-Meier curve of allograft survival for kidney transplant patients stratified by primary glomerular disease diagnosis following recurrent disease (A) or acute rejection (B). Panel A shows allograft survival following biopsy-confirmed recurrent glomerular disease, stratified by primary disease (P = .05 for IgA vs LN, MN, and FSGS). Panel B shows graft survival following biopsy diagnosis of acute rejection, stratified by primary disease (P = .10 for IgA vs LN, MN, and FSGS). IgA (solid gray line), FSGS (dashed black line), MN (dashed gray line), or LN (solid black line)
