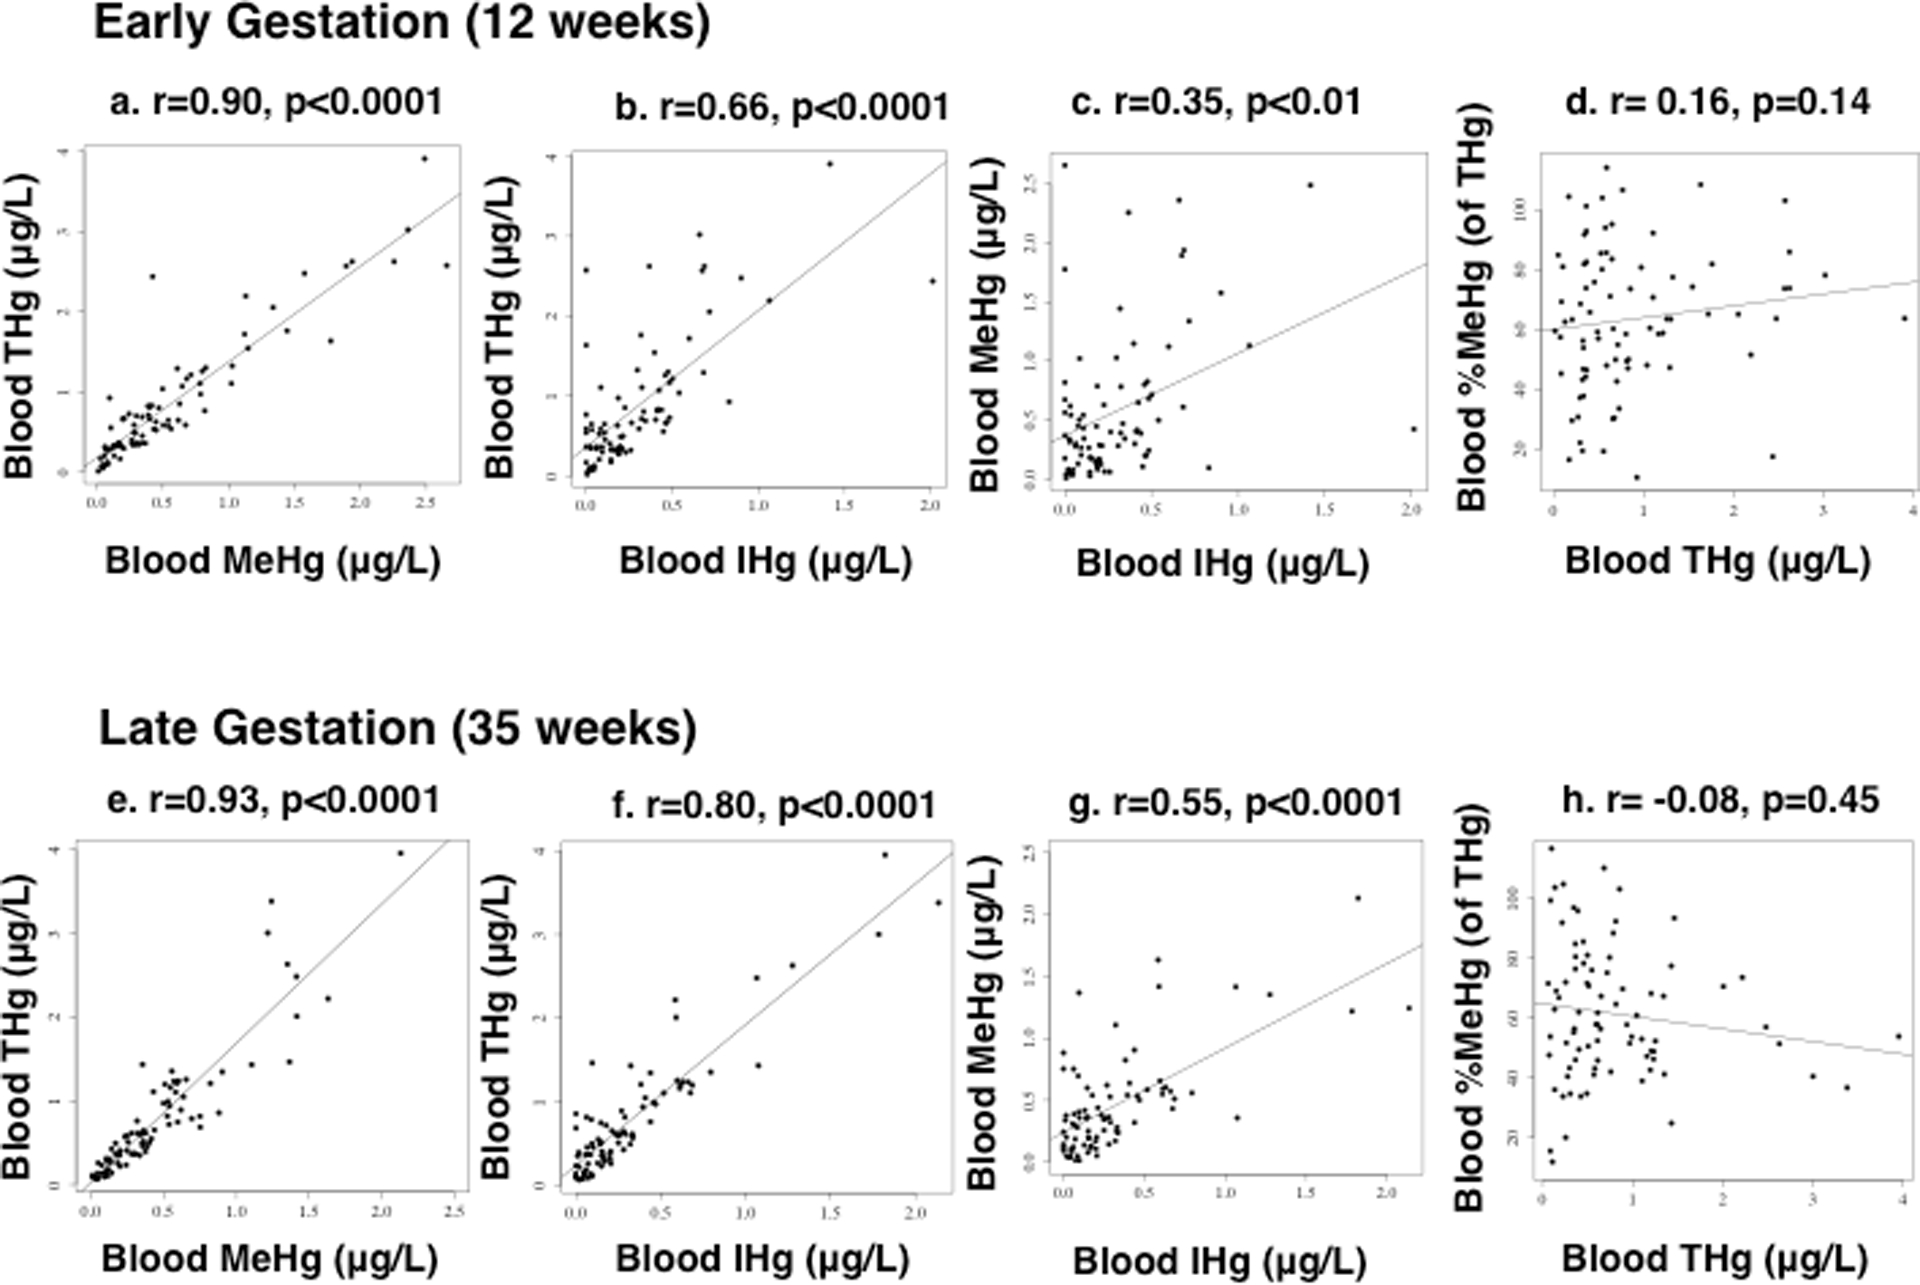
Figure 1.

Bivariate scatterplots relating (non-transformed) maternal blood mercury during early (12 ± 1.7 weeks) (figures a–d) and late (35 ± 2.0 weeks) gestation (figures e–h), including: (a, e) total mercury (THg) versus methylmercury (MeHg), (b, f) THg versus inorganic mercury (IHg), (c, g) MeHg versus IHg, and (d, h) %MeHg (of THg) versus THg (n=83 mothers). Spearman’s rho (r) and p-values are reported.
