Fig. 2.
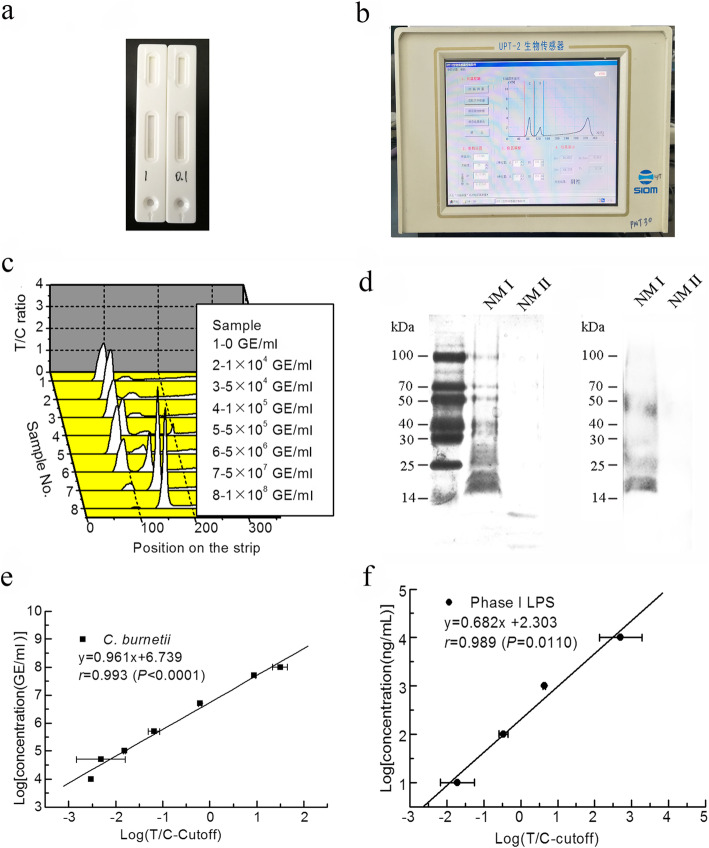
The detection limit, sensitivity, and precision of Coxiella-UPT-LF. a Photograph of a UPT-LF strip. b Photograph of the UPT biosensor. c Illustrations of the UPT assay for the detection of C. burnetii Xinqiao strain. Peaks on the left are signals for the control bands, and peaks on the right are for test bands. d LPS immunoblot of C. burnetii NMI and NMII. LPS of C. burnetii NMI and NMII was separated by SDS-PAGE, silver-stained, and probed with PI LPS-specific mAbs (10B5 and 10G7). e Standard curve for the quantification of C. burnetii Xinqiao strain by Coxiella-UPT-LF, with the logarithm of the difference between the T/C ratio and the cut-off value on the horizontal axis and the logarithm of the concentration (GE/ml) on the vertical axis. Data were expressed as mean ± SD, n = 3. f Standard curve for the quantification of NMI LPS by Coxiella-UPT-LF, with the logarithm of the difference between the T/C ratio and the cut-off value on the horizontal axis and the logarithm of the concentration (GE/ml) on the vertical axis. Data were expressed as mean ± SD, n = 3

